
Fundamental Overview
The USD sold off across the board on Friday following a softer than expected NFP report. Overall, the data wasn’t as bad as one might think by just looking at the reaction but given that we were positioned for a strong report and the pricing got more hawkish after the Fed’s decision, the weaker data was enough to trigger a quick repricing.
In fact, the market at some point was pricing 60 bps of easing by year-end compared to just 35 bps before the NFP release. That’s a pretty quick change of heart. Over the weekend, we also got Fed’s Williams opening the door for a cut in September and Fed’s Daly on Monday echoed the same sentiment. The NFP clearly made them a bit more worried, and a September cut seems now a done deal.
It’s highly likely that more benign data will see Fed Chair Powell opening the door for a cut in September at the Jackson Hole Symposium. Nonetheless, the ISM Services PMI yesterday showed a new high in the prices index which could keep traders on edge heading into the US CPI next week. Tomorrow, we get the US Jobless Claims and good data might trigger a rethink on the actual softness of the labour market.
On the CAD side, the underlying inflation in Canada has been rising steadily since last December and continues to hover near the upper bound of the 1-3% target range. The data out of Canada has been improving recently and the latest employment report surprised to the upside.
The BoC kept interest rates unchanged at the last meeting as expected and although it kept the door open for more rate adjustments, it’s unlikely to do so unless we get another growth shock. The market is pricing 18 bps of easing by year-end which is just a bit above the 50% probability.
USDCAD Technical Analysis – Daily Timeframe
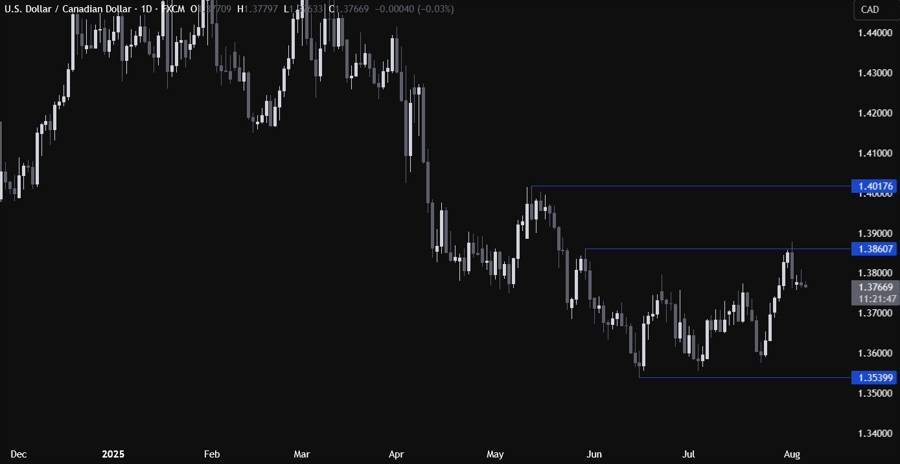
On the daily chart, we can see that USDCAD eventually rejected the key swing level at 1.3860 as the softer than expected NFP triggered a selloff in the US dollar. The price is now consolidating around the lower swing levels as traders await new catalysts.
If the price moves back to the 1.3860 level, we can expect the sellers to step in again with a defined risk above the resistance to position for a drop into the 1.35 handle. The buyers, on the other hand, will look for a break higher to increase the bullish bets into the 1.40 handle next.
USDCAD Technical Analysis – 4 hour Timeframe
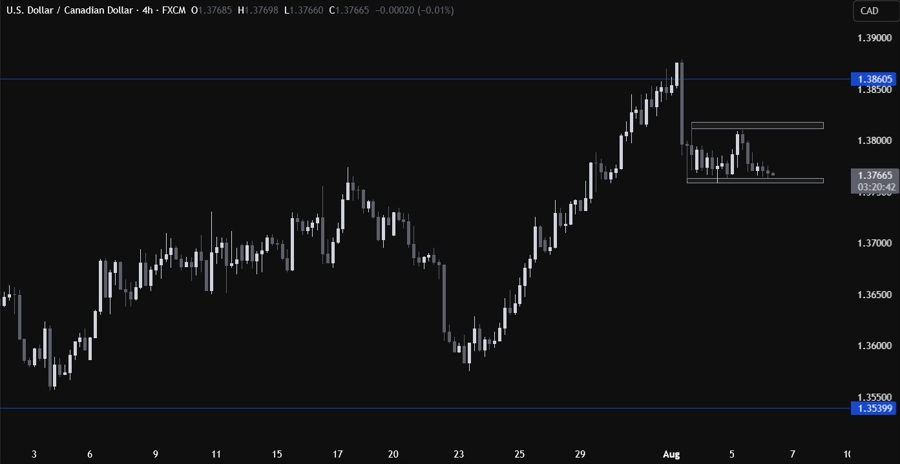
On the 4 hour chart, we can see more clearly the consolidation between the 1.3760 and 1.3815 levels. The buyers will likely step in around the lower bound to position for a move back into the upper bound. The sellers, on the other hand, will look for a break lower to extend the fall into the 1.37 handle next.
USDCAD Technical Analysis – 1 hour Timeframe
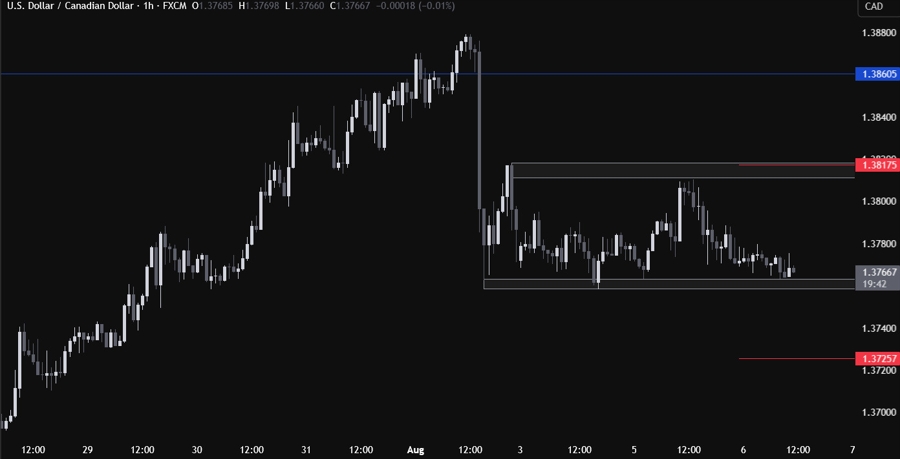
On the 1 hour chart, there’s not much else we can add here as the buyers will likely continue to pile in around the lower bound of the range to keep pushing into new highs, while the sellers will target a breakout to extend the fall into new lows. The red lines define the average daily range for today.
Upcoming Catalysts
Tomorrow we get the latest US Jobless Claims figures, while on Friday we conclude the week with the Canadian employment report.

