
Fundamental Overview
The USD sold off across the board on Friday following another soft NFP report. The dovish bets on the Fed increased as a result and the market is now expecting three rate cuts by year-end (70 bps). Moreover, we have also a 10% probability of a 50 bps cut in September but that will likely happen only if we get a soft CPI report on Thursday. In that case, the greenback will likely weaken further into the FOMC meeting.
Overall, if one zooms out, the US dollar continues to range although the dovish bets on the Fed keep weighing on the currency. Part of that could be the fact that the bearish positioning on the dollar could be overstretched and we might be at the peak of the dovish pricing.
In fact, if the rate cuts trigger stronger economic activity in the next months, the rate cuts in 2026 could be priced out and support the dollar. Nevertheless, the trend is still skewed to the downside, and we might need strong data to reverse it.
On the CAD side, the currency sold off across the board following the very weak Canadian employment report. The market quickly priced in a rate cut in September and added an extra rate cut by year-end (44 bps). The BoC is finding itself in a difficult spot with underlying inflation at the top of their target band and a deteriorating labour market.
USDCAD Technical Analysis – Daily Timeframe
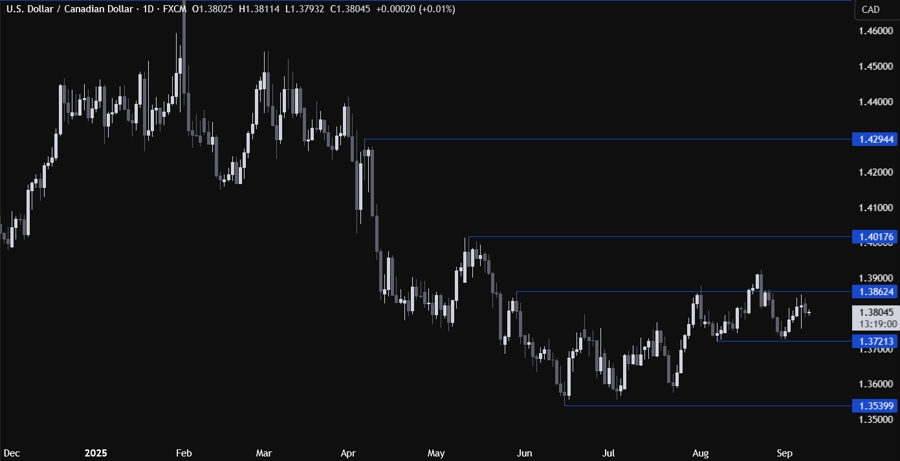
On the daily chart, we can see that USDCAD got rejected again around the 1.3860 swing level. The multiple rejections look like they formed a head and shoulders pattern, but we will need the price to break below the 1.3720 neckline to confirm it. For now, the sellers will likely continue to step in around the 1.3860 level, while the buyers will look for a break higher to increase the bullish bets into the 1.40 handle next.
USDCAD Technical Analysis – 4 hour Timeframe
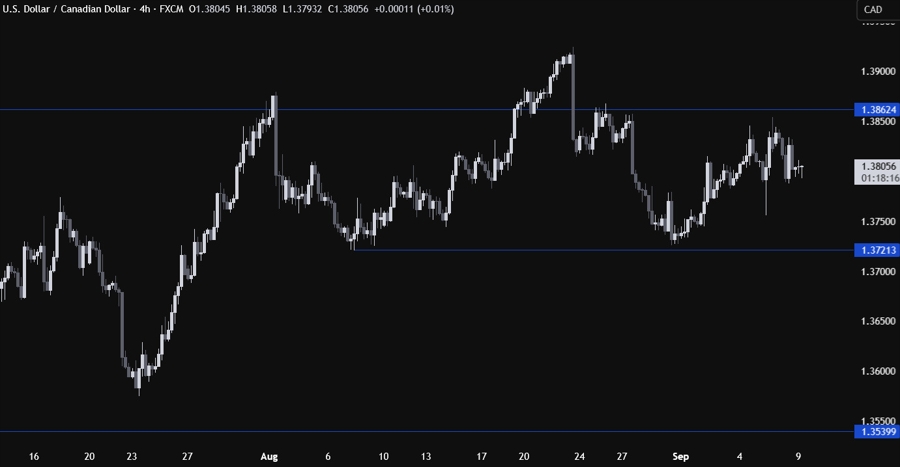
On the 4 hour chart, we can see more clearly the price action which has been mostly rangebound. There’s not much we can glean from this timeframe, but in case we get to the 1.3720 level, we can expect the buyers to step in with a defined risk below the level to position for a rally into the 1.40 handle with a better risk to reward setup. The sellers, on the other hand, will look for a break lower to increase the bearish bets into the 1.3550 level next.
USDCAD Technical Analysis – 1 hour Timeframe
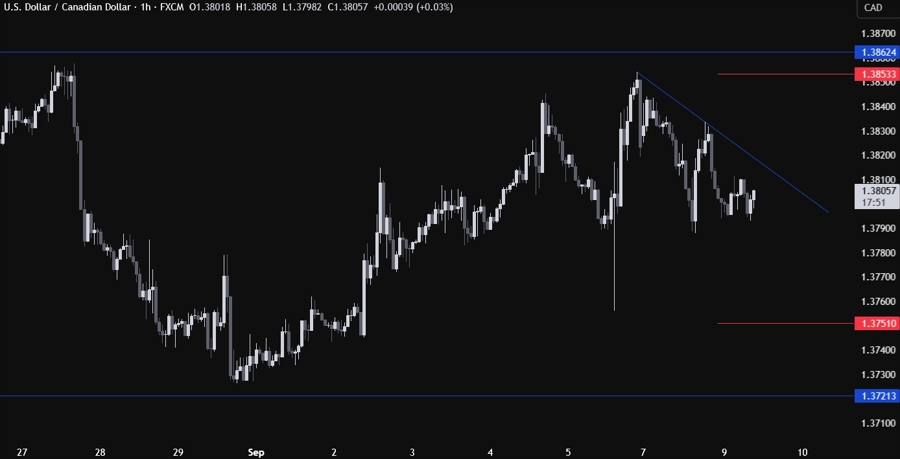
On the 1 hour chart, we can see that we have a minor downward trendline defining the bearish momentum on this timeframe. The sellers will likely lean on the trendline to keep pushing into new lows, while the buyers will look for a break higher to target a move into the 1.3860 level next. The red lines define the average daily range for today.
Upcoming Catalysts
Tomorrow we get the US PPI report. On Thursday, we get the US CPI report and the latest US Jobless Claims figures. On Friday, we conclude the week with the University of Michigan Consumer Sentiment report.

