
Fundamental Overview
The USD has weakened pretty much across the board last week despite a strong US ADP and ISM Services PMI. As mentioned previously, when markets react like that it’s generally a signal of a short-term top with the market needing more to keep the trend going.
In fact, the market pricing is now showing a 63% probability of a December cut, which is about right. The NFP and CPI reports will have the final say, and we should get them before the next FOMC decision.
On the CAD side, the BoC cut interest rates by 25 bps at the last meeting as expected bringing the policy rate to the lower bound of their estimated neutral rate range of 2.25%-3.25%. The central bank has also signalled that they reached the end of their cutting cycle, although they kept the door open for another cut if needed.
On Friday, we got another strong Canadian employment report with a notable fall in the unemployment rate from 7.1% to 6.9%. The data didn’t change anything for the BoC as the central bank won’t cut or hike at this point but helped to trim rate cut expectations further with the market now seeing just a 36% probability of another cut by the end of 2026.
USDCAD Technical Analysis – Daily Timeframe
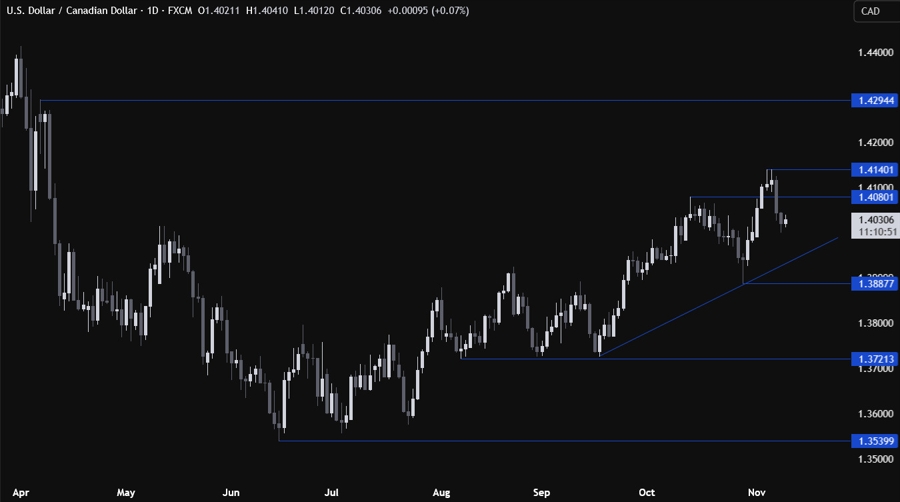
On the daily chart, we can see that USDCAD broke below the 1.4080 level following the strong Canadian employment report. The sellers piled in on the break and will likely target the trendline around the 1.3950 level. If we get there, we can expect the buyers to lean on the trendline with a defined risk below it to position for a rally into a new high.
USDCAD Technical Analysis – 4 hour Timeframe
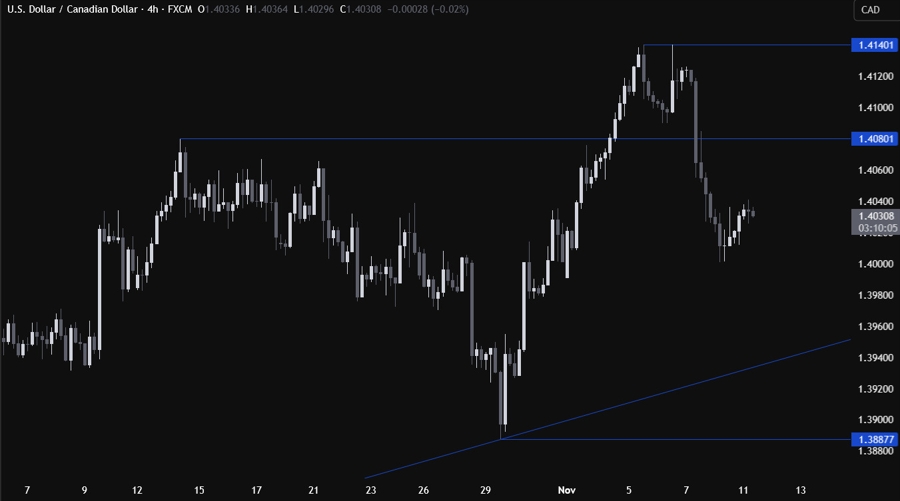
On the 4 hour chart, we can see that we are trading right in the middle of the two key levels, so there’s no strong level where to lean onto. If we get a pullback into the 1.4080 level, we can expect the sellers to step in with a defined risk above the level to position for a drop into the trendline. The buyers, on the other hand, will want to see the price breaking higher to pile in for a rally into new highs.
USDCAD Technical Analysis – 1 hour Timeframe
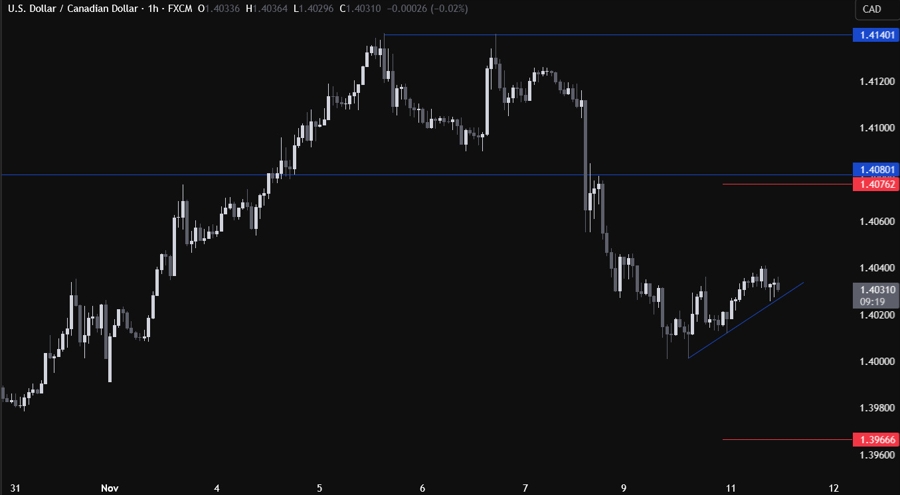
On the 1 hour chart, we can see that we have a counter-trendline acting as support. The buyers will likely continue to lean on it to keep pushing into new highs with a defined risk below it. The sellers, on the other hand, will look for a break lower to increase the bearish bets into the major trendline. The red lines define the average daily range for today.
Upcoming Catalysts
This week is pretty empty on the data front as we just have the weekly US ADP data tomorrow.


