Fundamental Overview
The USD performance has been mixed in the past days but still on net negative despite the decreasing December rate cut odds. It looks like the stock market is what has been driving all other markets.
In fact, when the stock market had positive days, we’ve seen Treasury yields and the US dollar rising, but when stocks performed poorly, Treasury yields and the greenback gave back the gains. The market might be thinking that a selloff in the stock market is going to weigh significantly on the economy, eventually requiring the Fed to cut more or more aggressively.
The focus now is of course on the Fed and the US data ahead of the December FOMC meeting. The market pricing is now showing just a 42% chance of a cut in December, so the data will have the final say.
I don't think the September NFP on Thursday is going to matter much if it's soft given that it's old data, but a strong report might be taken as meaningful because the market could think that conditions were already getting better in September before the two rate cuts.
Therefore, I think the November NFP is going to have the final say, which will hopefully get released just before the FOMC meeting in December (we won't get the November CPI in time).
On the CAD side, the BoC cut interest rates by 25 bps at the last meeting as expected bringing the policy rate to the lower bound of their estimated neutral rate range of 2.25%-3.25%. The central bank has also signalled that they reached the end of their cutting cycle, although they kept the door open for another cut if needed.
The recent data gave the BoC all the reasons to remain on the sidelines as we got another strong Canadian employment report and the inflation data showed the Trimmed Mean CPI Y/Y remaining around 3%.
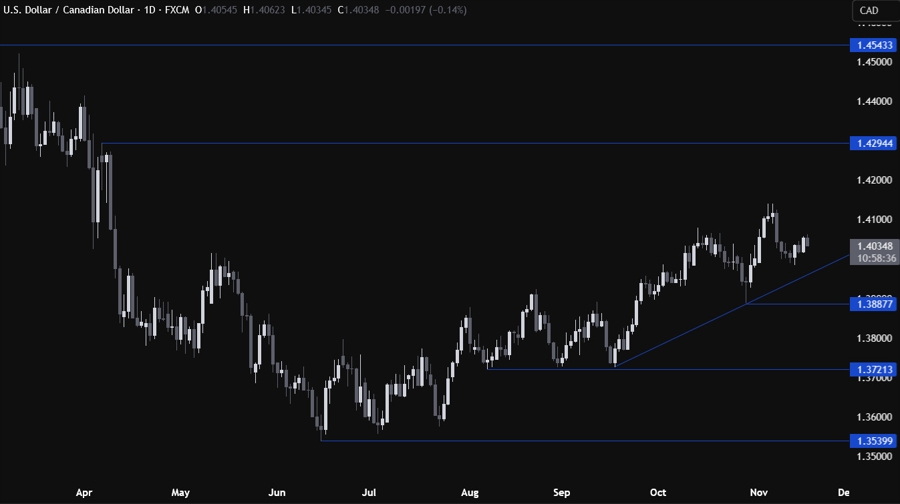
USDCAD Technical Analysis – Daily Timeframe

On the daily chart, we can see that we have a major trendline around the 1.3970 level. If the price gets there, we can expect the buyers to lean on the trendline with a defined risk below it to position for a rally into new highs. The sellers, on the other hand, will want to see the price falling below the trendline to increase the bearish bets into the 1.3887 level next.
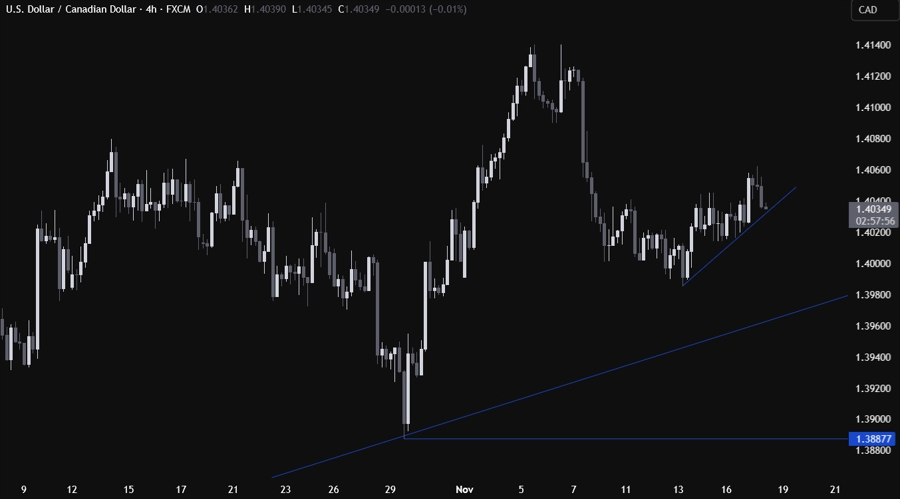
USDCAD Technical Analysis – 4 hour Timeframe

On the 4 hour chart, we can see that we have a minor upward trendline defining the current bullish momentum. The buyers are likely to lean on the trendline to keep pushing into new highs, while the sellers will look for a break lower to pile in for a drop into the major trendline.
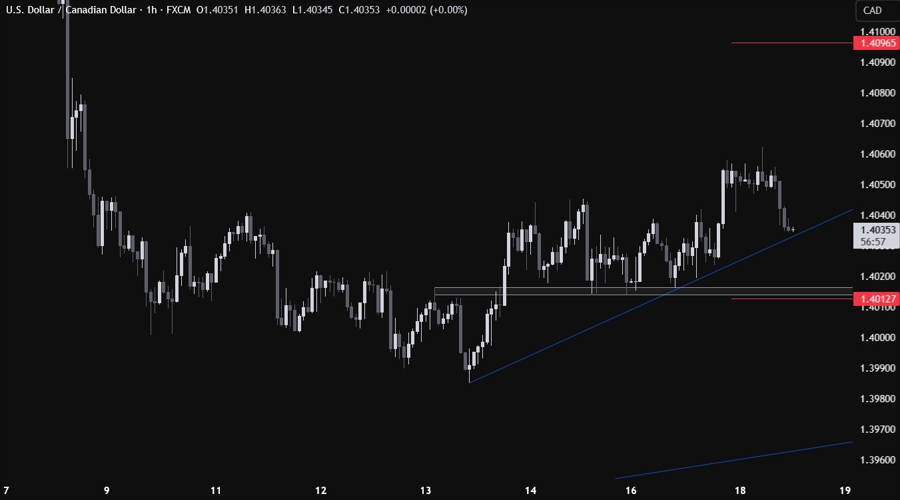
USDCAD Technical Analysis – 1 hour Timeframe

On the 1 hour chart, there’s not much else we can add here as the buyers will look for a bounce, while the sellers will target a break. We have also a minor support zone around the 1.4015 level where the dip-buyers could step in, but a break below that zone should have free road until the major trendline. The red lines define the average daily range for today.
Upcoming Catalysts
Today we get the weekly ADP jobs data. Tomorrow, we have the FOMC meeting minutes. On Thursday, we get the September NFP report and maybe the US Jobless Claims data. On Friday, we conclude the week with the Canadian Retail Sales data and the US Flash PMIs.

