
Fundamental Overview
The USD strengthened a bit on Friday following some positive Trump’s comments on China as Treasury yields bounced and erased the Thursday’s losses. Overall, the US dollar performance has been mixed as markets have been driven by quick changes in risk sentiment since Trump’s tariffs threat.
On the domestic side, the US government shutdown continues to delay many key US economic reports. The dollar “repricing trade” needs strong US data to keep going, especially on the labour market side, so any hiccup on that front is weighing on the greenback.
The BLS will release the US CPI report on Friday despite the shutdown, so that’s going to be a key risk event. That will need to be seen in the context of US-China relations and any negative shock by that time though. If things go south, then the CPI will not matter much as growth fears will trump everything else.
On the CAD side, we got a strong employment report recently which reduced the probabilities for a cut in October to 56%. The risk-off sentiment triggered by Trump and some dovish comments from BoC Governor Macklem last week, increased the probabilities to 86%. It looks like the BoC prefers to cut no matter what in October and bring their policy rate to the lower bound of their estimated neutral rate, but the Canadian CPI data today might still trigger some hawkish repricing in case it surprises to the upside.
USDCAD Technical Analysis – Daily Timeframe
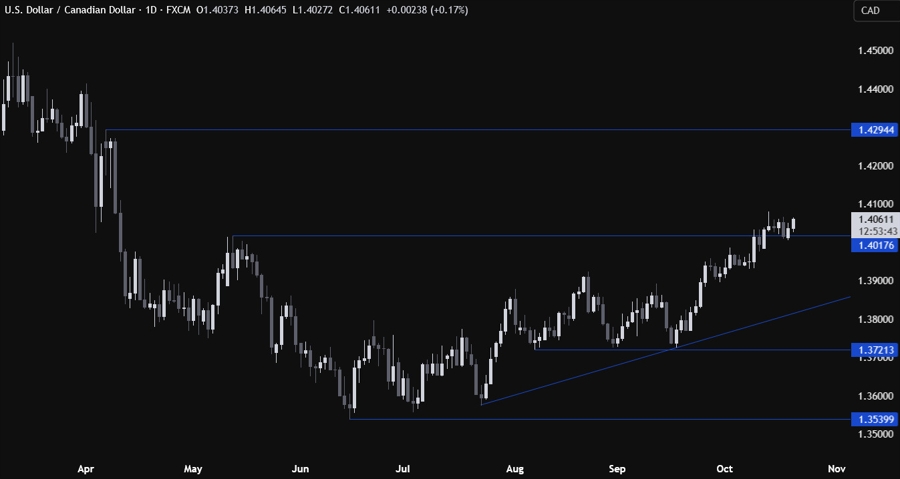
On the daily chart, we can see that USDCAD is consolidating above the key 1.4018 level. This is where the buyers are stepping in with a defined risk below the level to position for a rally into the 1.43 handle next. The sellers, on the other hand, will want to see the price falling back below the key level to target a pullback into the major trendline around the 1.3850 level.
USDCAD Technical Analysis – 4 hour Timeframe
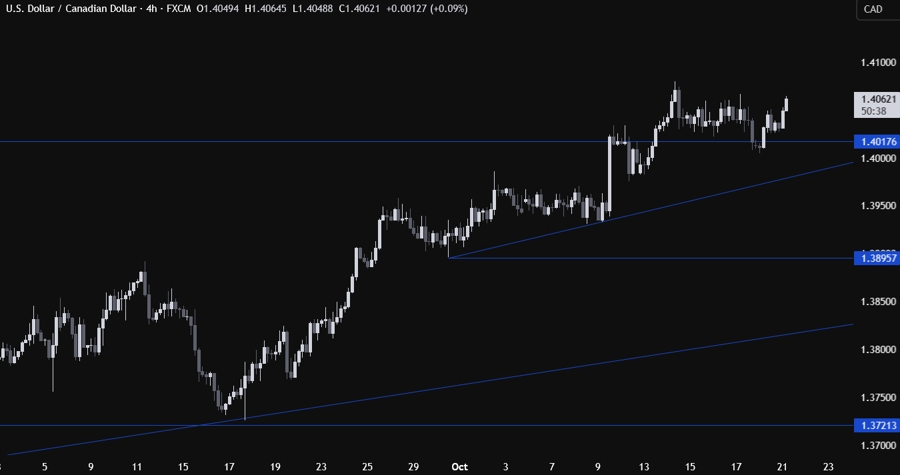
On the 4 hour chart, we can see that we have a minor upward trendline defining the bullish momentum. If we get a pullback, the buyers will likely lean on the trendline with a defined risk below it to keep pushing into new highs, while the sellers will look for a break lower to increase the bearish bets into new lows.
USDCAD Technical Analysis – 1 hour Timeframe
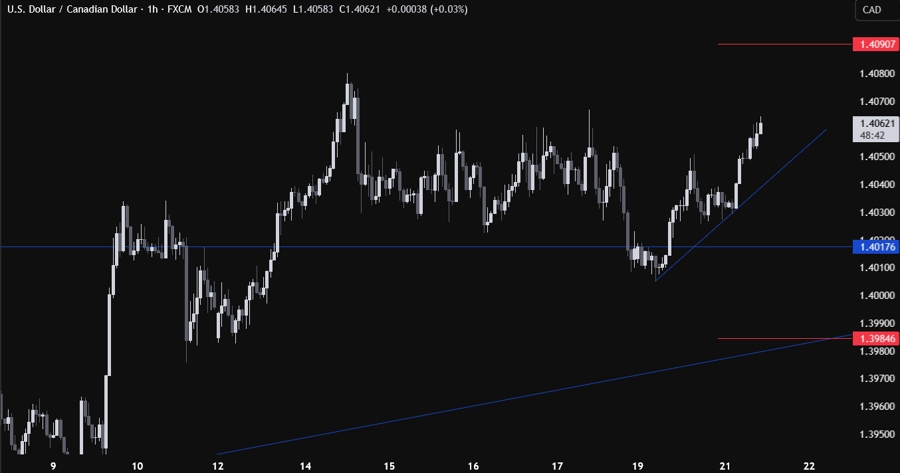
On the 1 hour chart, we can see that we have yet another minor upward trendline. Again, the buyers will likely lean on the trendline with a defined risk below it to keep pushing into new highs, while the sellers will look for a break lower to target a pullback into the next trendline. The red lines define the average daily range for today.
Upcoming Catalysts
Todaywe have the Canadian CPI report, while on Friday we get the US CPI and the US Flash PMIs.


