
Fundamental Overview
The USD rallied across the board last week after a slate of strong US data. The focus was mainly on Jobless Claims which beat expectations by a big margin with Initial Claims falling to the lowest level since July and Continuing Claims improving further. This triggered a hawkish repricing in interest rates expectations since the Fed started cutting rates solely due to weaker labour market data.
This means that if we continue to get stronger labour market data, the Fed could start turning more hawkish again and we might not get another cut in October, or more probably in December. Therefore, there’s still plenty of room for the US dollar to appreciate in case of strong data as the market’s pricing remains too dovish. The Fed projected 75 bps of easing by the end of 2026, while the market is still pricing 105 bps.
The greenback erased all the gains triggered by last week’s data in the meantime as we are likely experiencing a pullback after a very strong rally. Other possible reasons include the government shutdown fears and quarter-end flows.
On the CAD side, the BoC cut interest rates by 25 bps as expected at the last meeting following the very weak Canadian employment report. Overall, the central bank stressed the need to remain attentive to risks and setting policy on a meeting-by-meeting basis. The market is pricing a 51% of no change at the upcoming meeting in October and 20 bps of easing by year-end. So, the market is still expecting at least another cut this year. Next week, we have the Canadian employment report and that will likely tell us if the BoC is going to cut again in October or not.
USDCAD Technical Analysis – Daily Timeframe
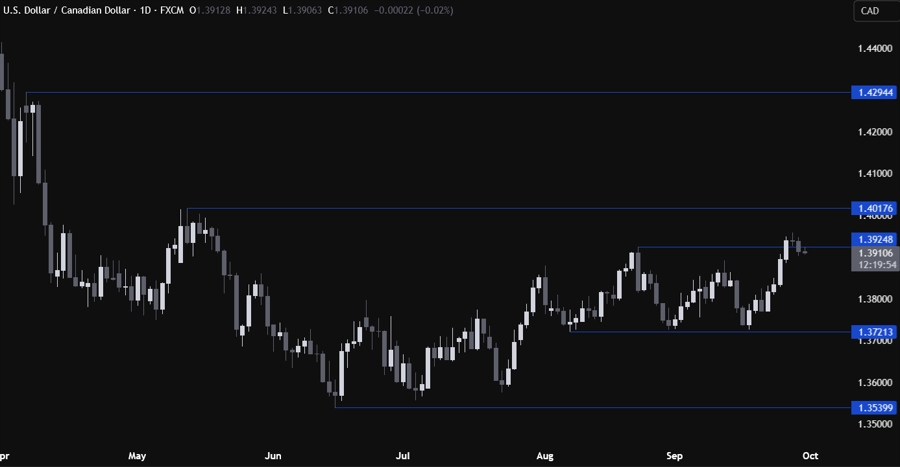
On the daily chart, we can see that USDCAD pushed above the August high last week invalidating the head and shoulders pattern that was forming around the 1.3862 level. The price has fallen back below the August high yesterday and this could bring more selling pressure. In fact, the sellers will likely step in around these levels with a defined risk above the 1.3925 level to position for a drop back into the 1.3721 support. The buyers, on the other hand, will want to see the price rising back above the 1.3925 level to increase the bullish bets into the 1.4017 level next.
USDCAD Technical Analysis – 4 hour Timeframe
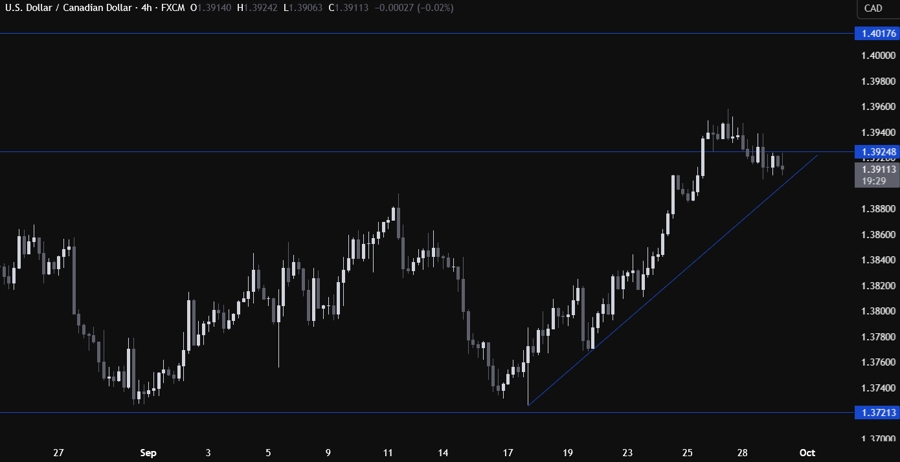
On the 4 hour chart, we can see that we have an upward trendline defining the bullish momentum. The buyers will likely lean on the trendline with a defined risk below it to keep pushing into new highs, while the sellers will look for a break lower to increase the bearish bets into the 1.3721 support next.
USDCAD Technical Analysis – 1 hour Timeframe
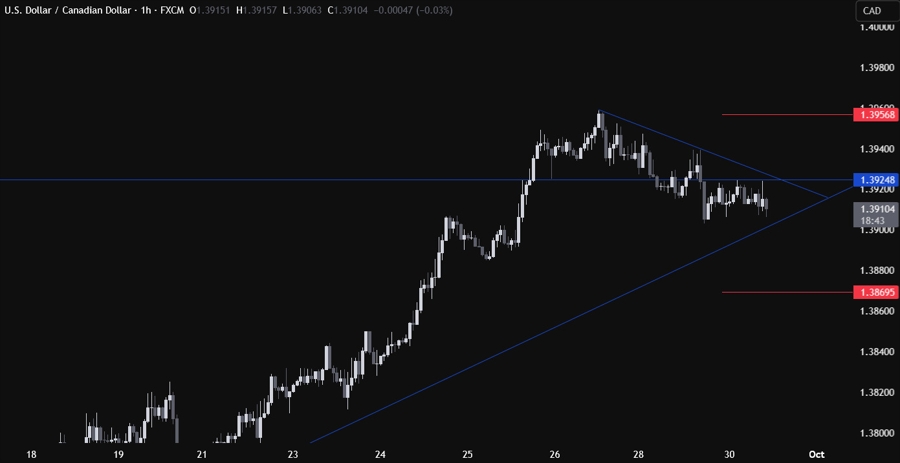
On the 1 hour chart, we can see that we have a minor downward trendline defining the current pullback. The sellers will likely continue to lean on the trendline to keep pushing into new lows, while the buyers will look for a break higher to increase the bullish bets into new highs. The red lines define the average daily range for today.
Upcoming Catalysts
Today we get the US Job Openings data and the US Consumer Confidence report. Tomorrow, we have the US ADP and the US ISM Manufacturing PMI. On Thursday, we get the latest US Jobless Claims figures. On Friday, we conclude the week with the US NFP report and the US ISM Services PMI. Keep also an eye on Fed speakers.


