Fundamental Overview
The USD yesterday weakened across the board on the Fed’s decision but eventually erased all the losses and increased the gains as traders digested all the information and realised it was more hawkish compared to market pricing.
In fact, the dot plot showed that the FOMC projected two more rate cuts for 2025 by a narrow majority, with the rest of officials expecting just one more or even none. Moreover, the Fed projected just one cut in 2026 compared to three that the market was pricing before the decision.
Fed Chair Powell then labelled the rate cut as a “risk management” action given the weakening in the labour market data. But overall, he sounded pretty neutral even though he understandably placed more emphasis on the labour market given the two consecutive soft NFP reports.
Looking forward, it’s going to be all about the data. Strong data will likely trigger a hawkish repricing in interest rates expectations and support the greenback. On the other hand, weak data will likely continue to weigh on it.
On the CAD side, the BoC cut interest rates by 25 bps as expected following the very weak Canadian employment report. Overall, the central bank stressed the need to remain attentive to risks and setting policy on a meeting-by-meeting basis. The market pricing remained largely unchanged with 19 bps of easing priced in by year-end and 60% probability of no change at the upcoming meeting in October.
Summary of BoC and FOMC decisions
USDCAD Technical Analysis – Daily Timeframe
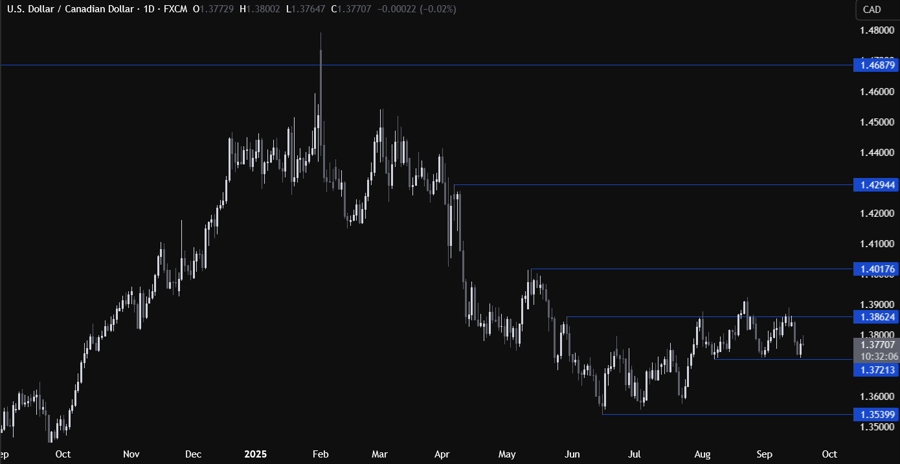
On the daily chart, we can see that USDCAD dropped all the way back to the 1.3720 level. This support could also be the neckline of the head and shoulders pattern formed at the 1.3862 resistance. The buyers will likely continue to step in around the support with a defined risk below it to position for a rally into the 1.40 handle. The sellers, on the other hand, will want to see the price breaking lower to increase the bearish bets into the 1.3540 low next.
USDCAD Technical Analysis – 4 hour Timeframe
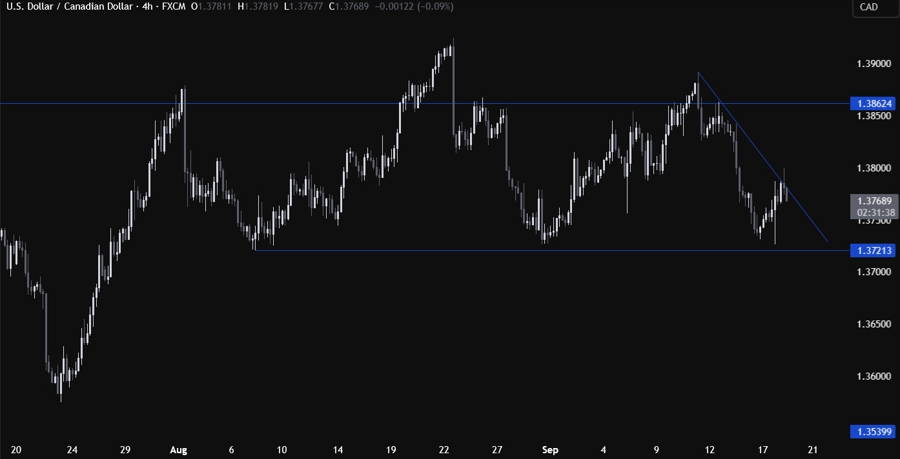
On the 4 hour chart, we can see that we have a minor downward trendline defining the bearish momentum. The sellers stepped in around the trendline with a defined risk above it to target a break below the neckline. The buyers, on the other hand, will want to see the price breaking higher to increase the bullish bets into the 1.3862 resistance next.
USDCAD Technical Analysis – 1 hour Timeframe

On the 1 hour chart, we can see that we have a minor support zone around the 1.3765 level. This is where we can expect the buyers to step in with a defined risk below the support to position for a rally into the 1.3862 resistance. The sellers, on the other hand, will look for a break lower to increase the bearish bets into the 1.3720 support targeting a breakout. The red lines define the average daily range for today.
Upcoming Catalysts
Today we get the latest US Jobless Claims figures. Tomorrow, we conclude the week with the Canadian retail sales data.