
Fundamental Overview
The USD rallied across the board yesterday after a slate of strong US data. The focus was mainly on Jobless Claims which beat expectations by a big margin with Initial Claims falling to the lowest level since July and Continuing Claims improving further. This triggered a hawkish repricing in interest rates expectations with the market now seeing 39 bps of easing by year-end vs 44 bps previously and 101 bps by the end of 2026 vs 113 prior.
Fed speakers this week haven’t offered anything new and just reiterated that the labour market weakness “forced” them to move towards neutral. This means that if we continue to get stronger labour market data, the Fed could start turning more hawkish again and we might not get another cut in October or December. Therefore, there’s still plenty of room for the US dollar to appreciate as the market’s pricing remains too dovish.
On the CAD side, the BoC cut interest rates by 25 bps as expected last week following the very weak Canadian employment report. Overall, the central bank stressed the need to remain attentive to risks and setting policy on a meeting-by-meeting basis. The market is pricing a 51% of no change at the upcoming meeting in October and 20 bps of easing by year-end. So, the market is still expecting at least another cut this year.
USDCAD Technical Analysis – Daily Timeframe
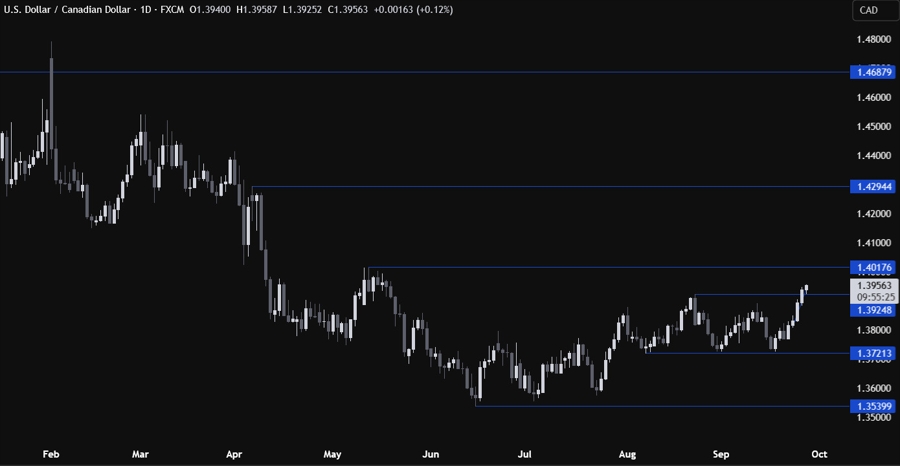
On the daily chart, we can see that USDCAD rallied above the August high invalidating the head and shoulders pattern that was forming around the 1.3862 level. The buyers will likely keep on targeting the 1.4017 level, while the sellers will look to step in around that level with a defined risk above it to position for a drop back into the 1.3721 level next.
USDCAD Technical Analysis – 4 hour Timeframe
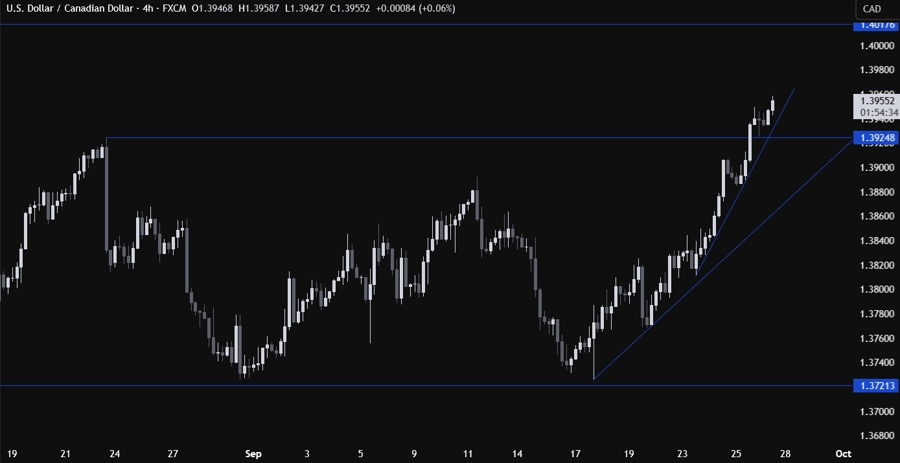
On the 4 hour chart, we can see that we have a couple of minor downward trendlines defining the bullish momentum. The buyers will likely continue to lean on the trendlines with a defined risk below them to keep pushing into new highs. The sellers, on the other hand, will look for downside breakouts to pile in for new lows.
USDCAD Technical Analysis – 1 hour Timeframe
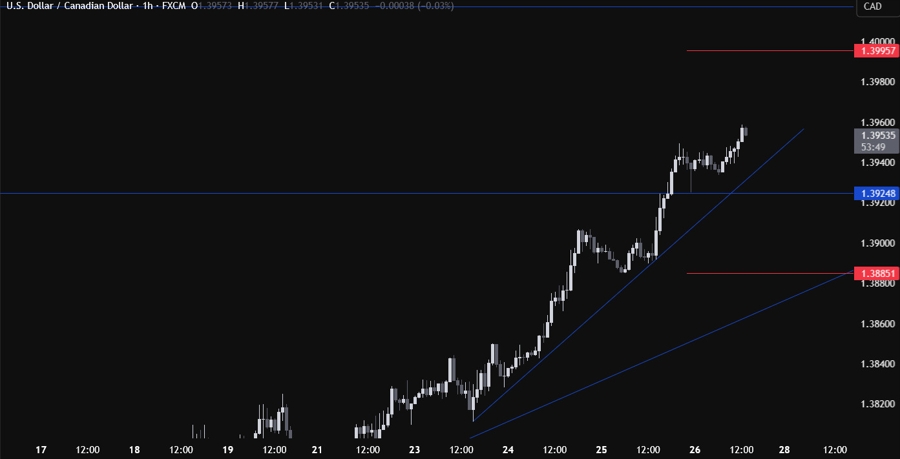
On the 1 hour chart, there’s not much we can add here as the buyers will likely lean on the trendline to keep pushing to the upside, while the sellers will look for a break below the trendline and the 1.3925 level to extend the pullback into the next trendline around the 1.3885 level. The red lines define the average daily range for today.
Upcoming Catalysts
Today we conclude the week with the Canadian GDP, the US PCE and the final University of Michigan Consumer Sentiment report.


