
FUNDAMENTAL OVERVIEW
USD:
The US dollar sold off across the board on Wednesday after Trump announced on Truth Social a two-sided ceasefire agreement for two weeks while the US and Iran negotiate a lasting peace deal. Since then, the price action became more rangebound due to Israeli attacks against Lebanon which the Iranians have been saying was part of the ceasefire agreement.
The good news is that Iran held off from retaliating ahead of the peace talks in Islamabad this weekend. But the uncertainty has been keeping the markets in check, nonetheless. Everything hinges on these peace talks as the restart of the war would create strong distress in the markets and potentially lead to a global recession.
In the short-term, a peace deal would weigh on the greenback amid renewed rate cut bets and unwinding of the March positioning. On the other hand, a breakdown of negotiations would give the dollar another boost, potentially pushing it into new highs.
CAD:
On the CAD side, the economic data has been surprising to the downside for a while. In such a case we would have seen traders pricing in rate cuts for the BoC but given the US-Iran conflict and the elevated energy prices, the market has been looking for rate hikes, which would just increase the damage to the economy.
The BoC is current in a neutral stance and it’s being cautious about the monetary policy response to this negative supply shock. Despite the market pricing in now 36 bps of tightening by year-end, the BoC is more likely to just keep rate steady for longer unless the war ends and we get a demand boost.
USDCAD TECHNICAL ANALYSIS – DAILY TIMEFRAME
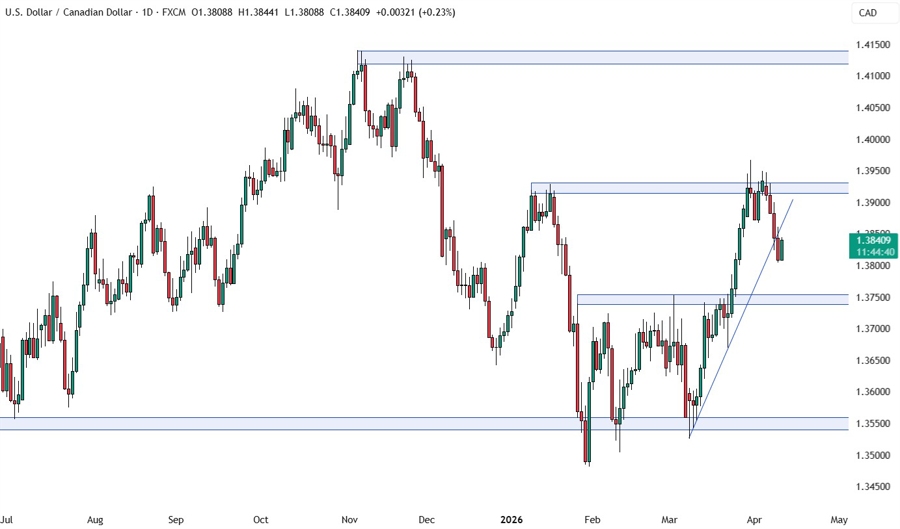
On the daily chart, we can see that USDCAD broke below the upward trendline that was defining the bullish momentum. This might give the sellers more conviction to keep pushing into new lows. There’s not much else we can glean from this timeframe, so we need to zoom in to see some more details.
USDCAD TECHNICAL ANALYSIS – 4 HOUR TIMEFRAME
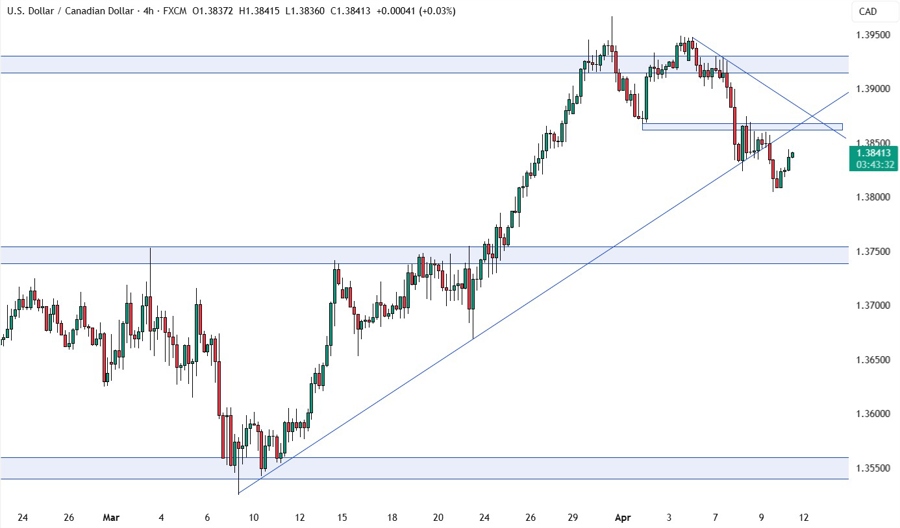
On the 4 hour chart, we have a resistance zone around the 1.3870 level where there’s also the confluence of the major broken upward trendline and the minor downward trendline. If the price gets there, we can expect the sellers to step in with a defined risk above the downward trendline to position for a drop into the 1.3750 support. The buyers, on the other hand, will look for a break higher to pile in for a rally into the 1.40 handle next.
USDCAD TECHNICAL ANALYSIS – 1 HOUR TIMEFRAME
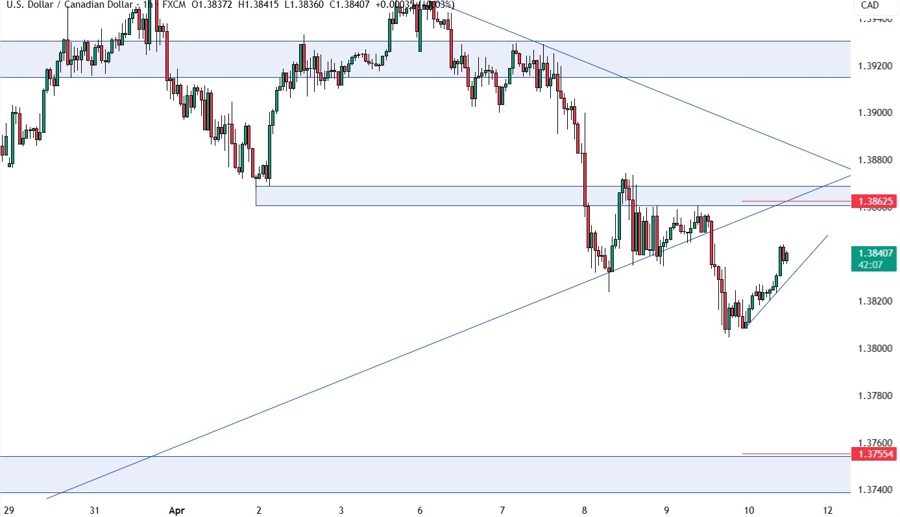
On the 1 hour chart, we have a minor upward trendline defining the current pullback into the resistance. The buyers will likely continue to lean on the trendline to keep pushing into new highs, while the sellers will look for a break to pile in for a drop into new lows. The red lines define the average daily range for today.
UPCOMING CATALYSTS
Today we conclude the week with the Canadian Employment data, the US CPI report and the University of Michigan Consumer Sentiment survey.


