
FUNDAMENTAL OVERVIEW
USD:
The US dollar weakened across the board yesterday after Trump basically confirmed the WSJ report in a Truth Social post that he would be open to end the war with Iran without the Strait of Hormuz opening condition.
This turned the sentiment around in the markets and the positive mood improved further later in the day when the Iranian President said that they were ready to end the war but wanted guarantees.
As you would expect, traders went back to price rate cuts for the Fed with 13 bps of easing seen by year-end compared to 3 bps yesterday.
JPY:
On the JPY side, the currency strengthened just because of dollar weakness as the Japanese macro conditions aren’t really pointing toward further tightening at the moment.
In fact, the latest Tokyo CPI showed core inflation falling further below the BoJ’s 2% target. There’s clearly no urgency to hike rates, but the BoJ might look to deliver one if the yen weakens much further.
USDJPY TECHNICAL ANALYSIS – DAILY TIMEFRAME
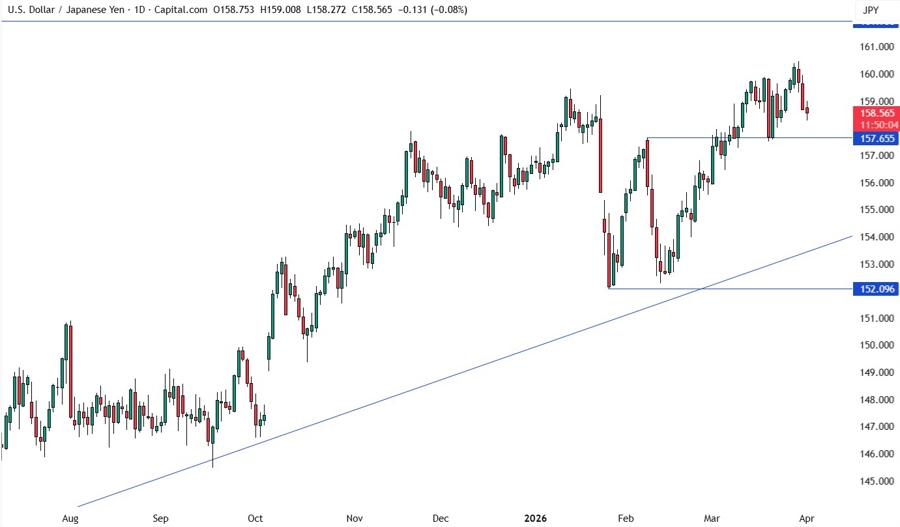
On the daily chart, we can see that USDJPY continues to pull back into the 157.65 support. If the price gets there, we can expect the buyers to step in with a defined risk below the support to position for a rally into the 161.95 level next. The sellers, on the other hand, will look for a break to pile in for a drop into the major trendline around the 154.00 handle.
USDJPY TECHNICAL ANALYSIS – 4 HOUR TIMEFRAME
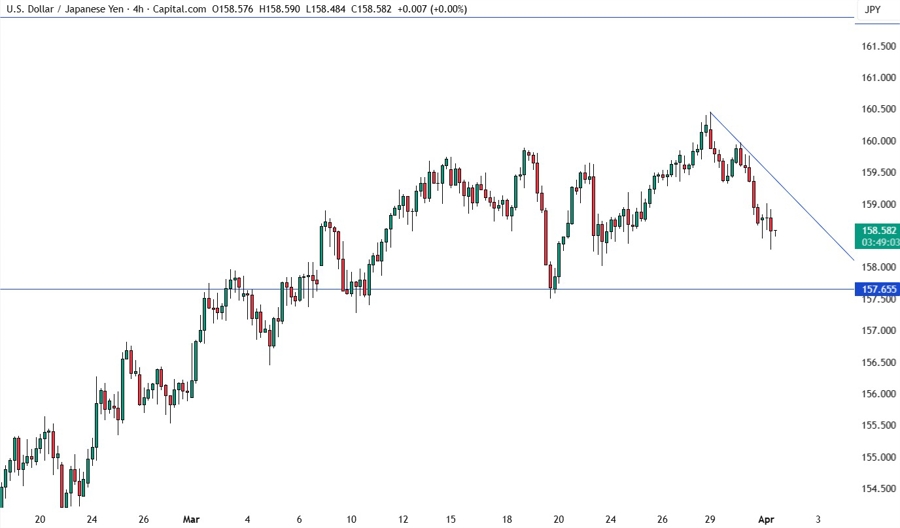
On the 4 hour chart, we have a minor downward trendline defining the current pullback. The sellers will likely continue to lean on the trendline to keep pushing into new lows, while the buyers will look for a break to pile in for a rally into new highs.
USDJPY TECHNICAL ANALYSIS – 1 HOUR TIMEFRAME
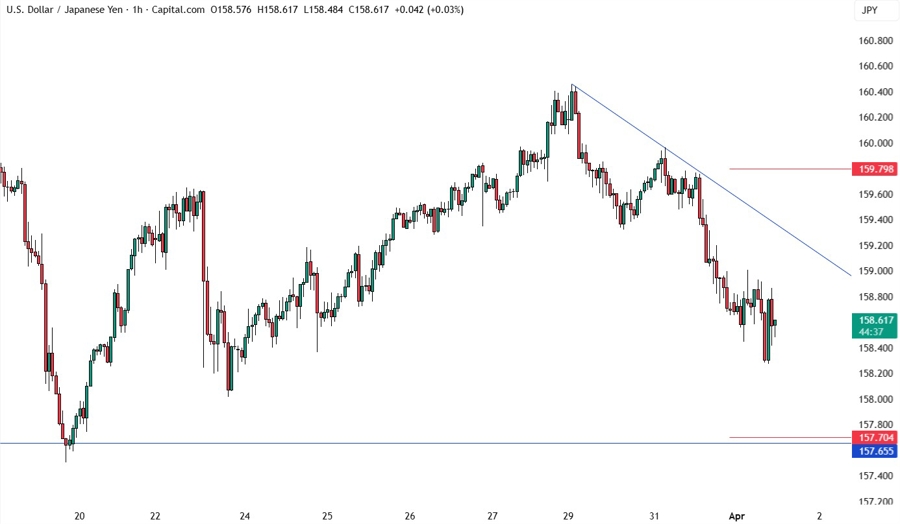
On the 1 hour chart, there’s not much we can add here as the sellers will have a better risk to reward setup around the downward trendline, while the buyers will look for a bounce around the support or a break above the downward trendline to position for new highs. The red lines define the average daily range for today.
UPCOMING CATALYSTS
Today we have the US ADP, the US Retail Sales and the US ISM Manufacturing PMI. On Thursday, we get the latest US Jobless Claims figures. On Friday, we conclude the week with the US NFP report. Do note that we have also Trump addressing the nation today at 21:00 ET/01:00 GMT giving an “important” update on Iran.


