
FUNDAMENTAL OVERVIEW
USD:
The US dollar has been trading mostly sideways after the hot US NFP report and the slightly soft US CPI data of last week. The market firmed up rate cut bets with 60 bps of easing seen by year-end but overall, the data didn’t really change anything in the bigger picture.
The bearish positioning in the US dollar remains crowded, so it’s hard to see much more weakness unless the data deteriorates significantly or we get some kind of negative shock in the economy. This week, all the important stuff will be released on Friday as we get the US Flash PMIs and the US Q4 GDP. We might also get the US Supreme Court decision on Trump's tariffs.
NZD:
On the NZD side, the currency dropped across the board as the RBNZ held the OCR unchanged at 2.25% as widely expected today but disappointed the hawkish expectations. In fact, the market expected the central bank to bring the first rate hike forward to December 2026, but the RBNZ didn’t meet those expectations.
Moreover, the overall message wasn’t as hawkish as expected, on the contrary, the central bank erred on the cautious side and focused more on the weak spots in the economy and downplayed the recent rise in inflation.
NZDUSD TECHNICAL ANALYSIS – DAILY TIMEFRAME
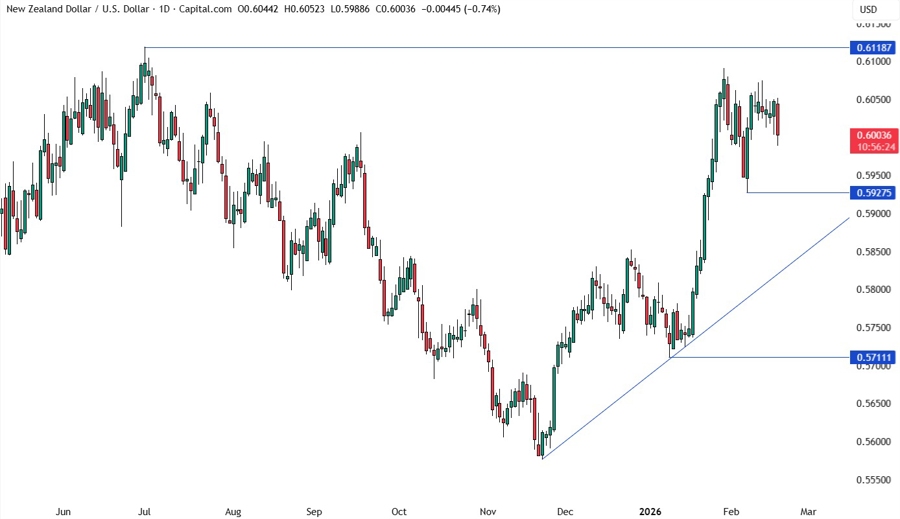
On the daily chart, we can see that the NZDUSD has been mostly consolidating near the highs after the strong rally at the end of January. There’s not much we can glean from this timeframe, so we need to zoom in to see some more details.
NZDUSD TECHNICAL ANALYSIS – 4 HOUR TIMEFRAME
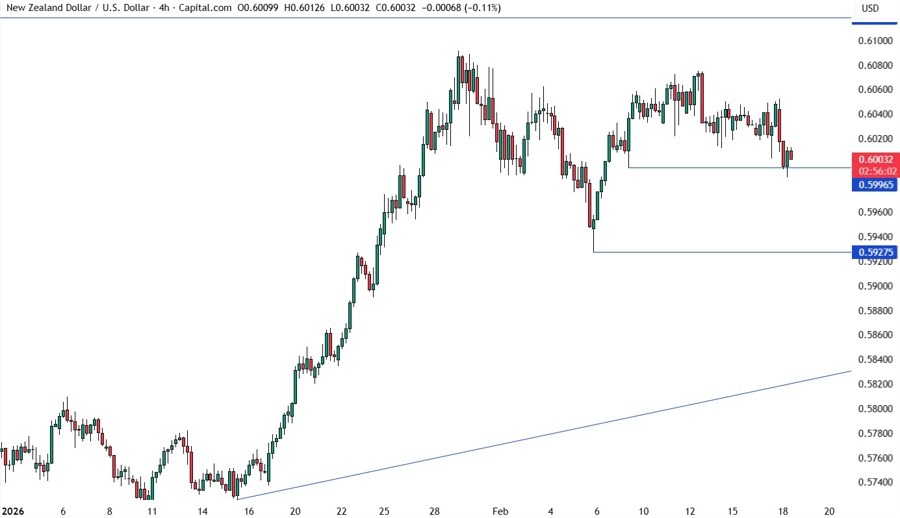
On the 4 hour chart, we can see that we have a key swing point around the 0.5995 level acting as support. We can expect the buyers to continue stepping in around this level with a defined risk below it to keep targeting the 0.61 handle. The sellers, on the other hand, will look for a break lower to pile in for a drop into the 0.5927 level next.
NZDUSD TECHNICAL ANALYSIS – 1 HOUR TIMEFRAME
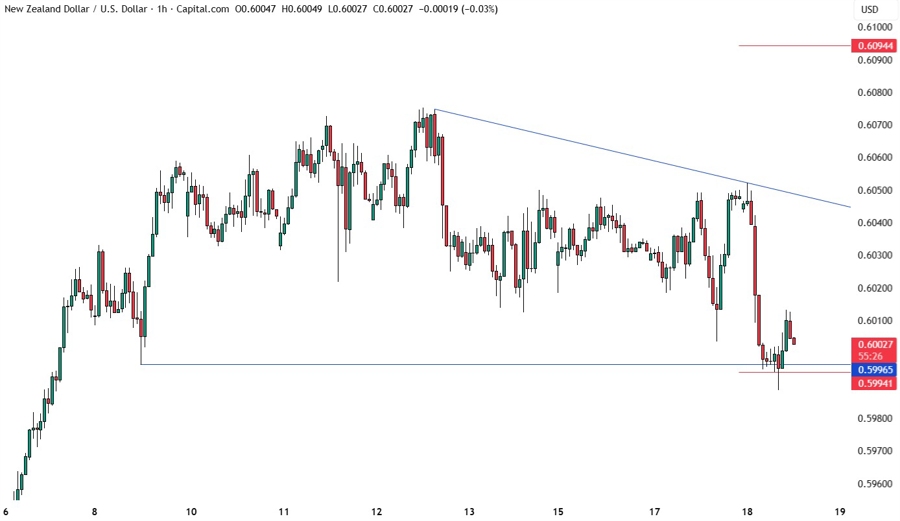
On the 1 hour chart, we can see that we have a minor downward trendline defining the current pullback into the 0.5995 support. If we get a bounce, we can expect the sellers to lean on the trendline with a defined risk above it to keep targeting a break below the support and new lows. The buyers, on the other hand, will look for a break higher to increase the bullish bets into the 0.61 handle next. The red lines define the average daily range for today.
UPCOMING CATALYSTS
Today we have the FOMC Meeting Minutes. Tomorrow, we get the latest US Jobless Claims figures. On Friday, we conclude the week with the US Q4 GDP, the US PCE price index for December, the US Flash PMIs and the potential US Supreme Court decision on Trump’s tariffs.


