
FUNDAMENTAL OVERVIEW
USD:
The US Dollar rebounded in the final part of last week with analysts pointing to the nomination of Kevin Warsh as the next Fed chair as the main catalyst. The reality is that the strong selloff in the greenback wasn’t backed by fundamentals in the first place. The greenback didn’t have strong reasons to appreciate, but there wasn’t a reason for a strong selloff either.
The US data continues to improve, especially on the labour market side as the US Jobless Claims suggest a re-acceleration in activity. Yesterday’s US ISM Manufacturing PMI beat expectations by a big margin with the new orders index jumping to the best levels since 2022. February might be the month when the US Dollar comes back with a vengeance if we keep getting strong data.
The NFP report is certainly the main highlight although it got delayed due to the partial shutdown. Nonetheless, we will get many other top tier data that could give the greenback a boost like the US ADP and the ISM Services PMI.
The market is pricing 48 bps of easing by year-end and those bets will be pared back in case the data strengthens. Conversely, if the data comes out softer than expected, then we could see the US Dollar coming back under pressure, although the momentum shouldn’t be as strong as we’ve seen in January.
INR:
The Indian Rupee remains on a bearish structural trend against the US Dollar, but the latest positive development on the tariffs front gave the INR a strong boost. In fact, US President Trump announced yesterday on Truth Social that they reached a deal with India and the US will lower the tariffs from 25% to 18%.
This week, we have also the RBI rate decision on Friday where the central bank is expected to hold interest rates steady after inflation increased to 1.33% in December vs 0.71% in November and analysts expecting further improvement towards the RBI’s target.
USDINR TECHNICAL ANALYSIS – DAILY TIMEFRAME
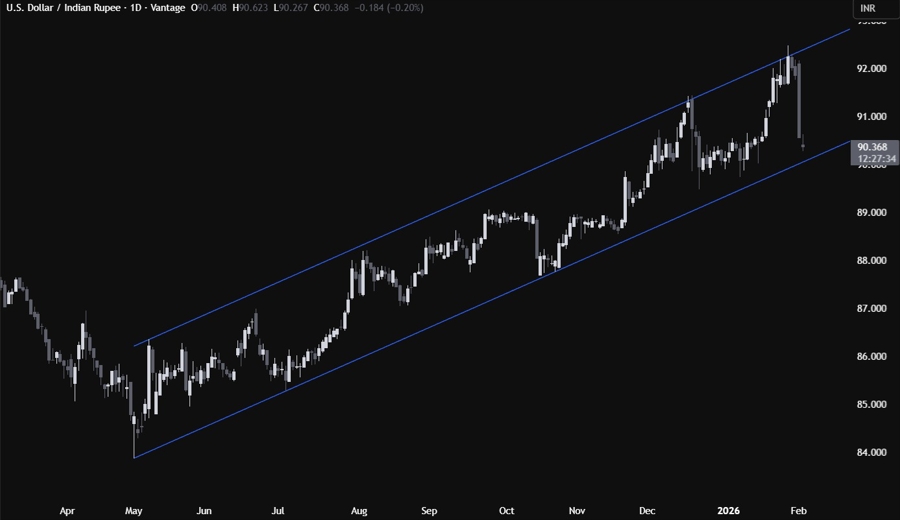
On the daily chart, we can see that USDINR eventually dropped from the upper bound of the channel and it’s now getting closer to the bottom trendline. We can expect the buyers to step in around the bottom trendline with a defined risk below it to position for a rally into the top trendline. The sellers, on the other hand, will look for a break lower to increase the bearish bets into the 89.00 handle next.
USDINR TECHNICAL ANALYSIS – 4 HOUR TIMEFRAME
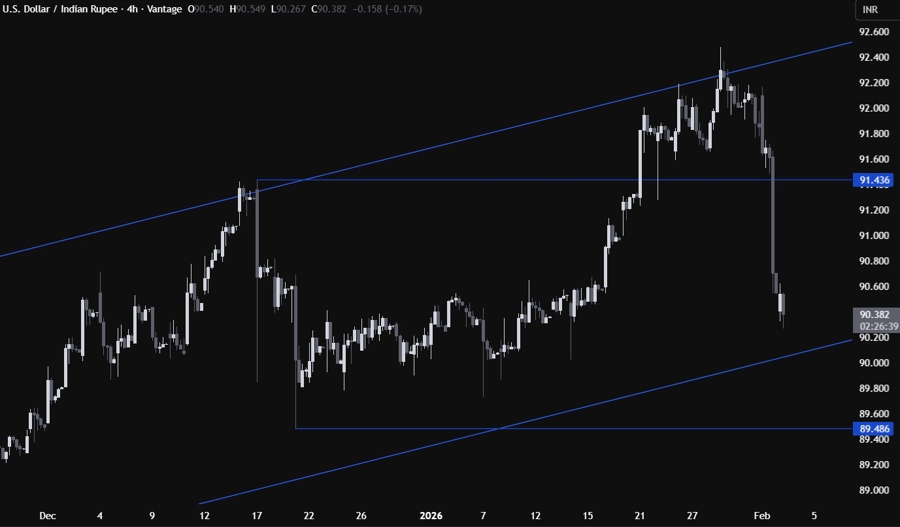
On the 4 hour chart, we can see more clearly the selloff in the pair triggered by the positive US-India developments. A break below the bottom trendline should open the door for a move into the swing level at 89.50 which could be the last line of defence for the buyers as a break below that level could change the medium-term trend.
USDINR TECHNICAL ANALYSIS – 1 HOUR TIMEFRAME
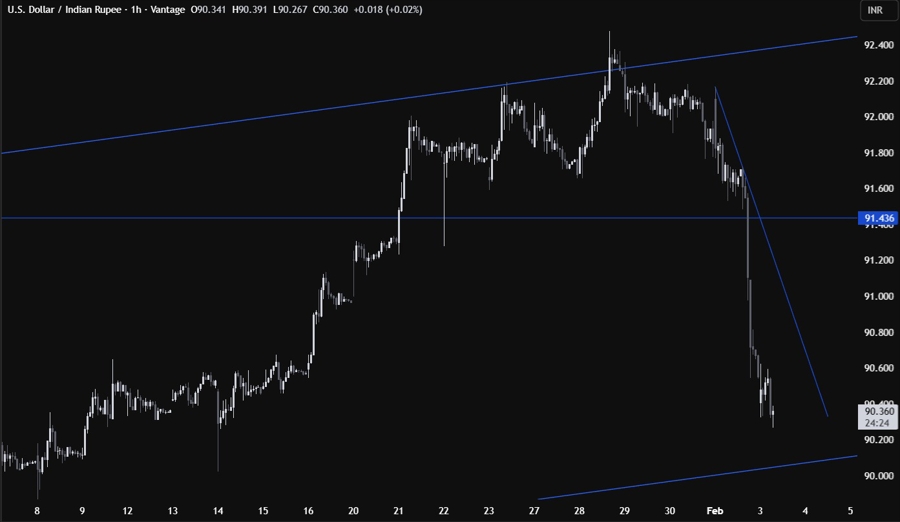
On the 1 hour chart, we can see that we have a minor downward trendline defining the bearish momentum. If we get a pullback, we can expect the sellers to lean on the trendline with a defined risk above it to keep pushing into new lows. The buyers, on the other hand, will look for a break higher to increase the bullish bets into the 91.42 level next.
UPCOMING CATALYSTS
Tomorrow the US ADP and the US ISM Services PMI. On Thursday, we get the US Jobless Claims figures. On Friday, we conclude the week with the RBI rate decision and the University of Michigan Consumer Sentiment data.


