
FUNDAMENTAL OVERVIEW
USD:
The US Dollar sold off across the board on Friday following rumours of the NY Fed conducting rate checks on the USD/JPY pair. The market took that as a signal of a potential intervention to strengthen the Japanese Yen and the unwinding of positions weighed on the greenback.
This wasn’t a fundamental-driven move but a “technical” one. In general, such reactions are eventually faded in the following days. The problem for the dollar is that there’s no strong reason for it to appreciate yet.
Tomorrow, we have the FOMC decision where the central bank is expected to keep interest rates unchanged and maintain a data-dependent approach for the next rate cuts. There shouldn’t be any surprise at this meeting. February might be key for the US Dollar as we get another set of economic data, with the NFP report likely being pivotal for the market pricing.
In fact, we’ve been seeing notable improvements in the US Jobless Claims data that could point to a re-acceleration in the labour market. The market is still pricing 46 bps of easing by year-end. Those bets are likely to be pared back in case the data strengthens and should provide support for the greenback.
INR:
The Indian Rupee remains on a bearish structural trend against the US Dollar, so the RBI’s interventions will continue to fail. Today India and the European Union signed a free trade agreement which India’s PM Modi called a “historic moment”. That could bring some positive sentiment for the Indian Rupee and give it a short-term boost.
On the monetary policy front, the latest India’s annual inflation rate increased to 1.33% in December compared to 0.71% in November. This is still way below the RBI’s 4% target but closer to the bottom of their tolerance band at 2%. Traders don’t expect the RBI to deliver another rate cut at the upcoming meeting in February.
USDINR TECHNICAL ANALYSIS – DAILY TIMEFRAME
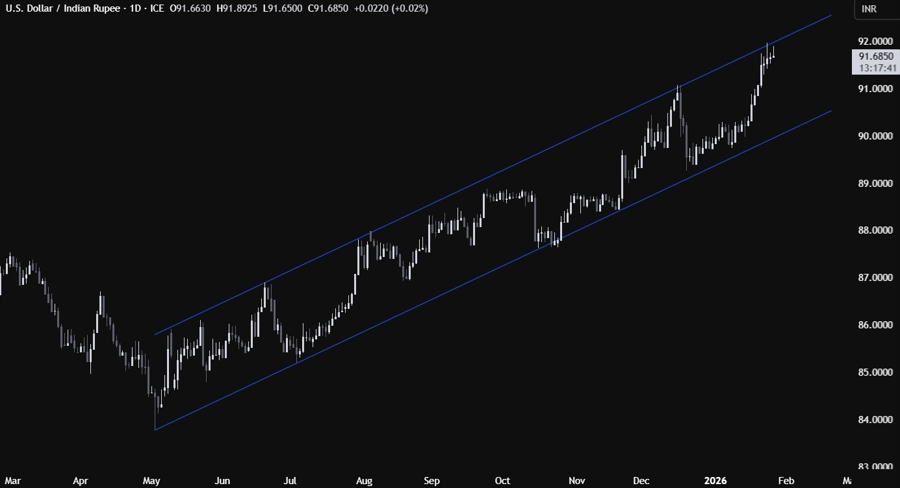
On the daily chart, we can see that USDINR eventually reached the upper bound of the channel near the 92.00 handle. This is where we can expect the sellers to step in with a defined risk above the top trendline to position for a correction into the lower bound of the channel. The buyers, on the other hand, will look for a break higher to increase the bullish bets into new record highs.
USDINR TECHNICAL ANALYSIS – 4 HOUR TIMEFRAME
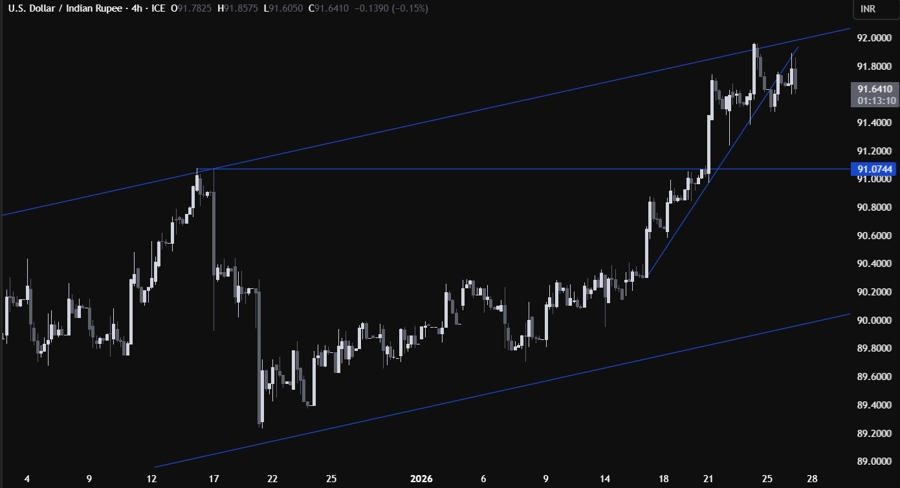
On the 4 hour chart, we can see that we had an upward minor trendline defining the bullish momentum on this timeframe. We got a break recently which could be a signal for a bigger pullback before another push to the upside. We have a strong support around the 91.00 handle. If the price gets there, we can expect the buyers to step in with a defined risk below the support to position for a rally into new highs. The sellers, on the other hand, will look for a break lower to increase the bearish bets into the lower bound of the channel.
USDINR TECHNICAL ANALYSIS – 1 HOUR TIMEFRAME
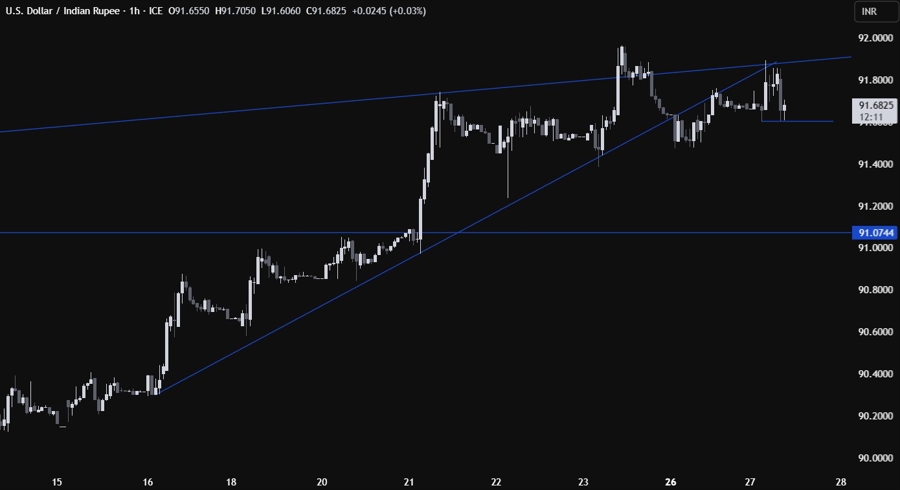
On the 1 hour chart, there’s not much else we can add here as the sellers will likely keep on positioning for a pullback into the 91.00 handle, while the buyers will want to see a break to the upside to increase the bullish bets into new highs. There’s a minor support around the 91.60 level that once broken should increase the bearish momentum into the 91.00 handle.
UPCOMING CATALYSTS
Today we have the weekly US ADP jobs data and the US Consumer Confidence report. Tomorrow, we have the FOMC policy announcement. On Thursday, we get the latest US Jobless Claims figures. On Friday, we conclude the week with the US PPI report.
