
FUNDAMENTAL OVERVIEW
USD:
The US dollar strengthened yesterday after Iran rejected the proposed ceasefire and outlined its own conditions that included closure of all US bases in the Gulf, reparations for the attacks, lifting of all sanctions and allowing Iran to retain its missile program without restrictions.
These conditions are of course unacceptable for the US, so we are now in a deadlock. For now, the US dollar is likely to remain supported until there is an official de-escalation.
INR:
The Indian rupee got some reprieve on Monday following Trump’s announcement of a five-day ceasefire, but the relief didn’t last long as mixed messages and pushbacks from the Iranian side led to a consolidation.
Traders are now wondering whether this was just the usual Trump’s strategy to jawbone the markets while the US prepares for a ground invasion. If that happens, we will likely see the USDINR pair skyrocketing again. On the other hand, if Trump decides to pull back militarily and end the hostilities, we should get a meaningful correction.
In the big picture, the Indian Rupee remains on a bearish structural trend against the US dollar, so the dip-buyers will likely look for opportunities around strong technical levels to keep pushing into new highs.
USDINR TECHNICAL ANALYSIS – DAILY TIMEFRAME
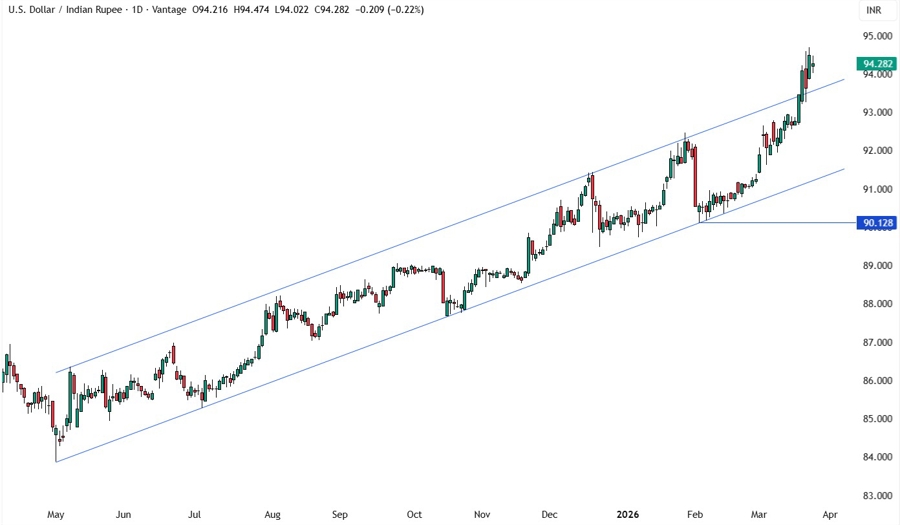
On the daily chart, we can see that USDINR broke out of the channel and surged above the 94.00 handle as the US-Iran war kept weighing on the rupee. If we get a pullback into the broken top trendline, we can expect the buyers to step in with a defined risk below it to keep pushing into new highs. The sellers, on the other hand, will want to see the price falling back inside the channel to position for a drop into the bottom trendline.
USDINR TECHNICAL ANALYSIS – 4 HOUR TIMEFRAME
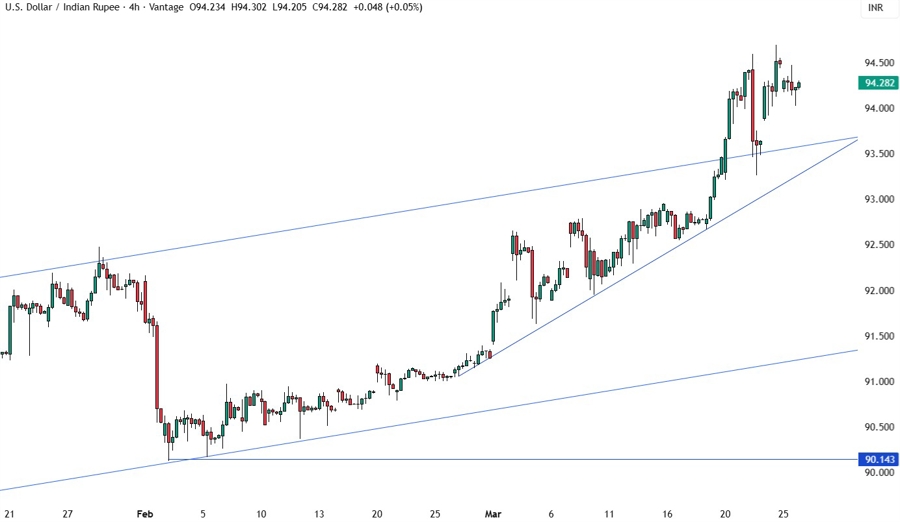
On the 4 hour chart, we have an upward trendline defining the bullish momentum. This adds confluence to the broken channel and should give the buyers more conviction to step in around the 93.50 level to keep targeting new highs. The sellers, on the other hand, will look for a break below the trendline to pile in for a drop back into the lower bound of the channel.
USDINR TECHNICAL ANALYSIS – 1 HOUR TIMEFRAME
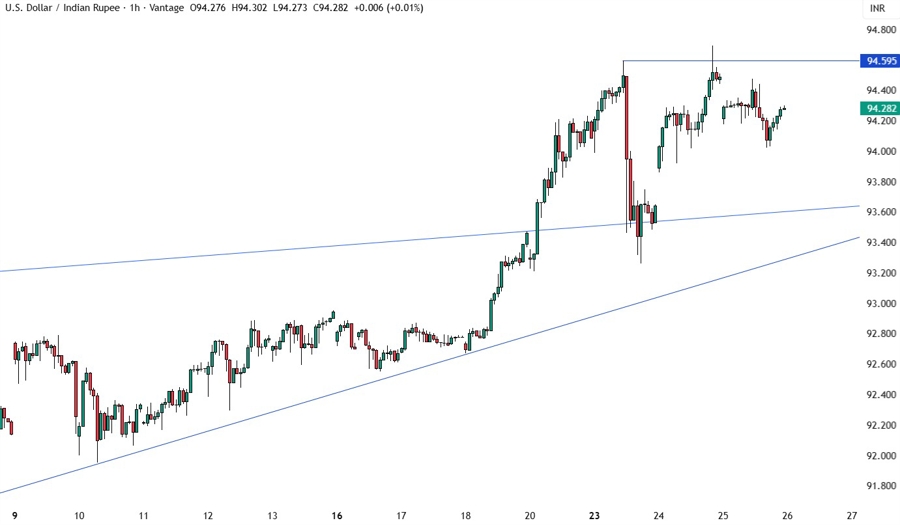
On the 1 hour chart, there’s not much we can add here but if we get a break above the recent highs around the 94.60 level, we can expect the buyers to increase the bullish bets into new highs. The sellers, on the other hand, will likely step in around the highs to target a pullback into the 93.50 level.
UPCOMING CATALYSTS
Today we get the latest US Jobless Claims figures.


