
FUNDAMENTAL OVERVIEW
USD:
The US Dollar recovered a little yesterday as Trump announced that he reached a “framework” of a deal for Greenland and that he won’t go ahead with tariffs. Moreover, we got Fed’s Cook hearing yesterday and the Supreme Court appeared likely to deny Trump's request to immediately fire her.
Barring another geopolitical escalation somewhere, the focus will switch to the US data and the Fed’s interest rate path for 2026. The data has been improving recently, especially on the labour market side. If we more of such or even better, that will likely keep supporting the US Dollar as rate cuts get slowly priced out. Right now, the market is pricing a total of 46 bps of easing by year-end.
AUD:
On the AUD side, we got a blockbuster Australian jobs report today with the unemployment rate falling to 4.1% vs 4.4% expected. This was a big hawkish surprise and the market responded by increasing the probabilities for a rate hike already at the upcoming meeting to 58%.
As a reminder, the RBA at the last policy decision sounded more hawkish following a series of higher-than-expected inflation reports. The central bank also discussed whether a rate hike might be needed at some point in 2026.
We still have the quarterly inflation report before the RBA’s meeting which could take the probabilities to 50% if we get soft figures. Conversely, stronger than expected data will seal the rate hike and could even raise the total tightening expected by year-end, which is seen at 47 bps at the moment (two rate hikes).
AUDUSD TECHNICAL ANALYSIS – DAILY TIMEFRAME
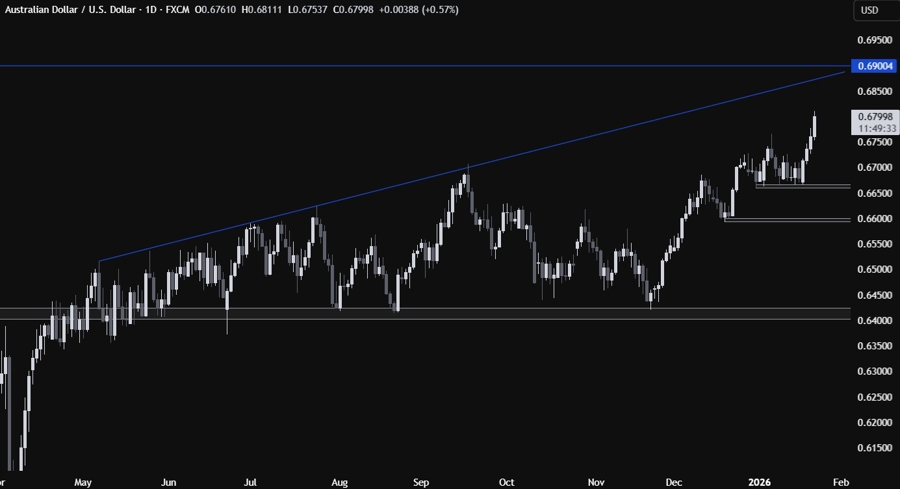
On the daily chart, we can see that AUDUSD extended the rally into new highs following the blockbuster Australian jobs report. The natural target for the buyers is the top trendline near the 0.69 handle. If the price gets there, we can expect the sellers to step in with a defined risk above the trendline to position for a drop back into the 0.6400 handle.
AUDUSD TECHNICAL ANALYSIS – 4 HOUR TIMEFRAME
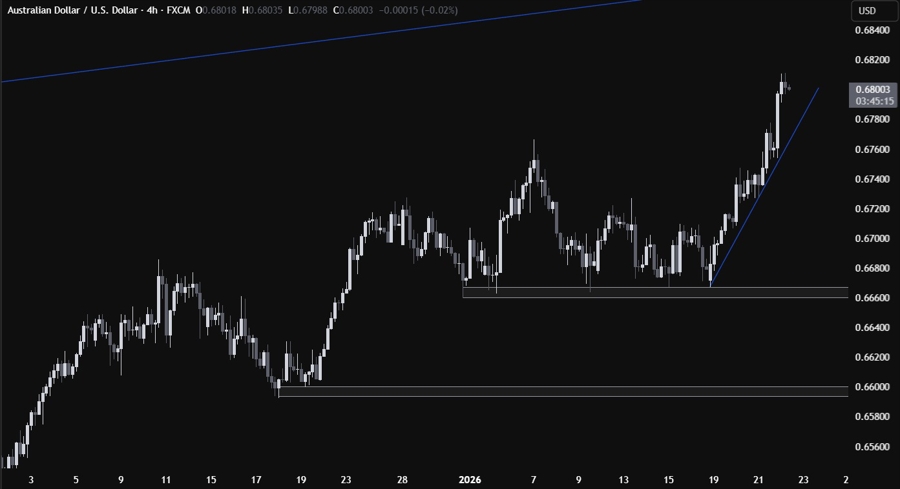
On the 4 hour chart, we can see that we have an upward trendline defining the bullish momentum on this timeframe. If we get a pullback, we can expect the buyers to lean on the trendline with a defined risk below it to position for a rally into new highs. The sellers, on the other hand, will look for a break lower to pile in for a drop into the 0.6660 level next.
AUDUSD TECHNICAL ANALYSIS – 1 HOUR TIMEFRAME
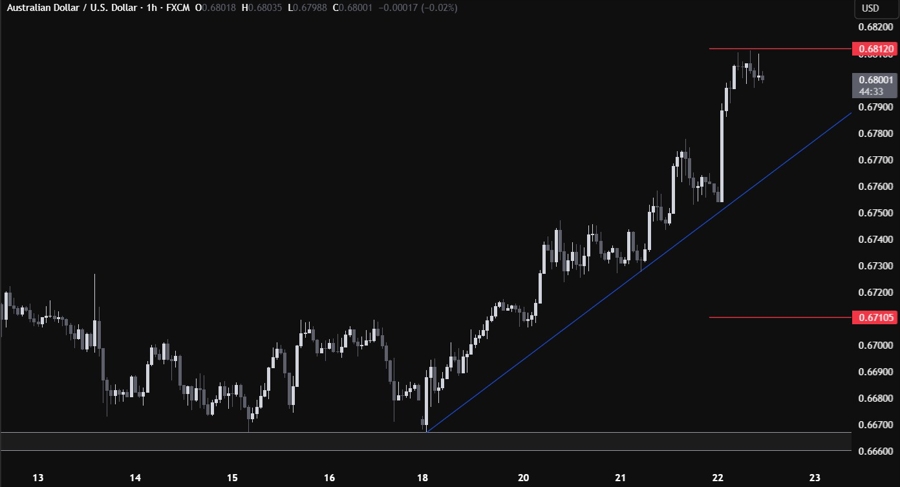
On the 1 hour chart, we can see that the price already reached the upper bound of the average daily range for today. In such instances, we can generally see some consolidation or a pullback before the next move. Again, the buyers will have a better risk to reward setup around the trendline, while the sellers will need a break lower to open the door for new lows.
UPCOMING CATALYSTS
Today we get the latest US Jobless Claims figures, while tomorrow we conclude the week with the US Flash PMIs.
