
FUNDAMENTAL OVERVIEW
USD:
The US Dollar had a good run last week on some unwinding of overstretched US Dollar shorts and mostly stronger US data. The bullish momentum eventually faded as we got a very weak US Job Openings report that coupled with the selloff in the stock market weighed on the market pricing. The focus has now turned to the US NFP report on Wednesday as that’s going to be pivotal for the US Dollar.
In fact, the market is pricing 54 bps of easing for the Fed this year, so there’s a high risk of a hawkish repricing in case the data comes out strong. In such a scenario, we will likely see the greenback rallying across the board.
On the other hand, a weak report should strengthen the case for more Fed easing and might even see traders bringing forward rate cut bets as some Fed members expressed scepticism about labour market stabilisation. In that case, the US Dollar will likely come under renewed pressure on dovish Fed bets.
AUD:
On the AUD side, the RBA hiked the Cash Rate by 25 bps as widely expected bringing it back to 3.85%. The central bank delivered a hawkish surprise as it signalled two more rate hikes by year-end compared to just one expected by the market at the time.
We got the hawkish repricing in interest rate expectations with traders now seeing 40 bps of tightening in 2026. The focus will remain on the data but it will need to be very hot to get the market to price in even more rate hikes.
AUDUSD TECHNICAL ANALYSIS – DAILY TIMEFRAME
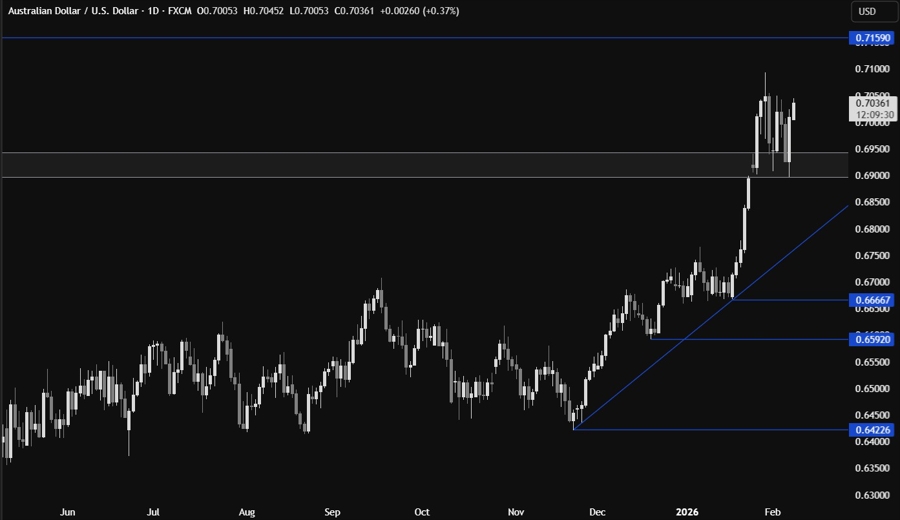
On the daily chart, we can see that AUDUSD retested the support zone around the 0.69 handle and eventually rallied as the US Dollar came under renewed pressure. The buyers continue to target the resistance zone around the 0.7150 level. If the price gets there, we can expect the sellers to step in with a defined risk above the resistance to position for a drop back into the 0.69 support. The buyers, on the other hand, will look for a break higher to increase the bullish bets into new cycle highs.
AUDUSD TECHNICAL ANALYSIS – 4 HOUR TIMEFRAME
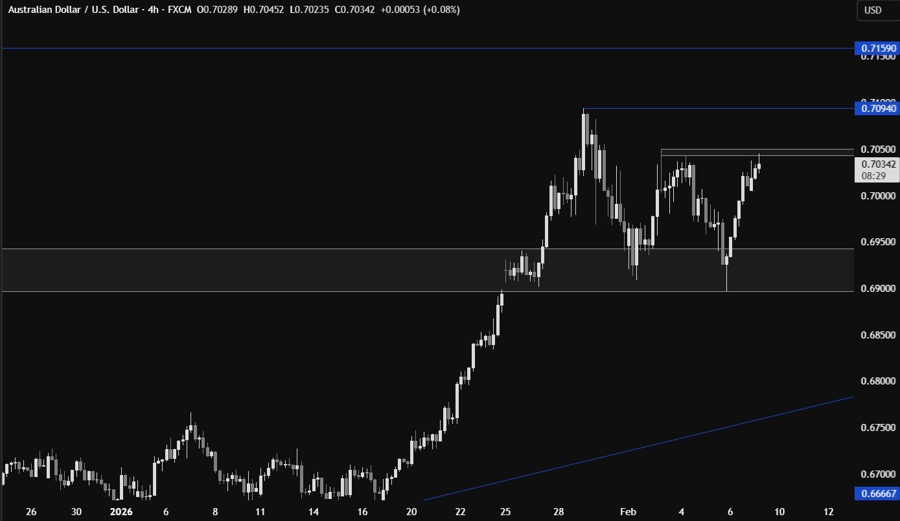
On the 4 hour chart, we can see we have a minor resistance zone around the 0.7050 level. This is where we can expect the sellers to step in with a defined risk above the resistance to position for a drop back into the 0.69 support targeting a breakout. The buyers, on the other hand, will look for a break higher to increase the bullish bets into the 0.7150 resistance next.
AUDUSD TECHNICAL ANALYSIS – 1 HOUR TIMEFRAME
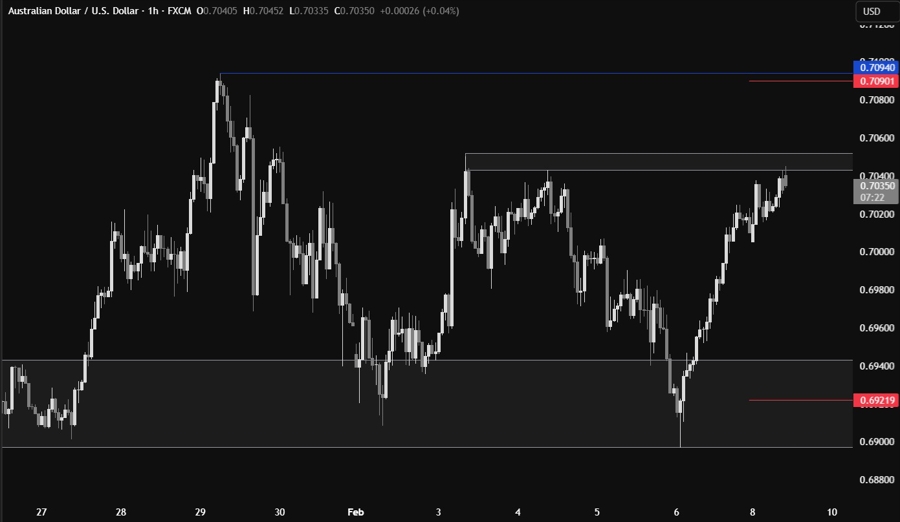
On the 1 hour chart, there’s not much else we can add here as the sellers will likely step in around these levels to target new lows, while the buyers will look for a break higher to extend the rally into new highs. The red lines define average daily range for today.
UPCOMING CATALYSTS
Tomorrow we get the US December Retail Sales and the US Employment Cost Index data. On Wednesday, we have the US NFP report. On Thursday, we get the US Jobless Claims figures. On Friday, we conclude the week with the US CPI report.


