
Fundamental Overview
The USD remains weak across the board as market participants now await the key US data releases with the government shutdown expected to end this week. Yesterday, we saw some more weakness following soft weekly ADP data that showed job losses in the second half of October.
The initial weakness didn’t hold though as the US dollar eventually regained some ground. It seems like the market is now just waiting for the government data to confirm the weakness and the December cut. In fact, the market pricing is still standing around 64% probability for a December cut.
On the NZD side, the RBNZ cut by 50 bps at the last meeting bringing the OCR to 2.5%, which is the lower bound of their estimated neutral range (2.5%-3.5%). They kept an easing bias though as they are trying to “feel their way” as RBNZ’s Conway recently said. The market is still pricing a 91% probability of a 25 bps cut at the upcoming meeting given lack of improvements in the economic data.
NZDUSD Technical Analysis – Daily Timeframe
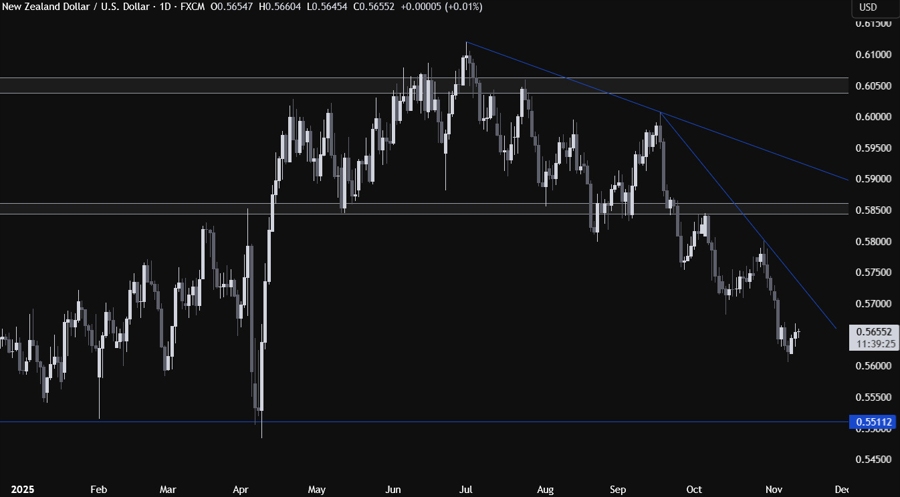
On the daily chart, we can see that the NZDUSD continues to consolidate around the recent lows. We have a major downward trendline 0.5700 handle. If we get a pullback into it, we can expect the sellers to lean on the trendline with a defined risk above it to position for a drop into new lows. The buyers, on the other hand, will want to see the price breaking higher to increase the bullish bets into the 0.5850 resistance next.
NZDUSD Technical Analysis – 4 hour Timeframe
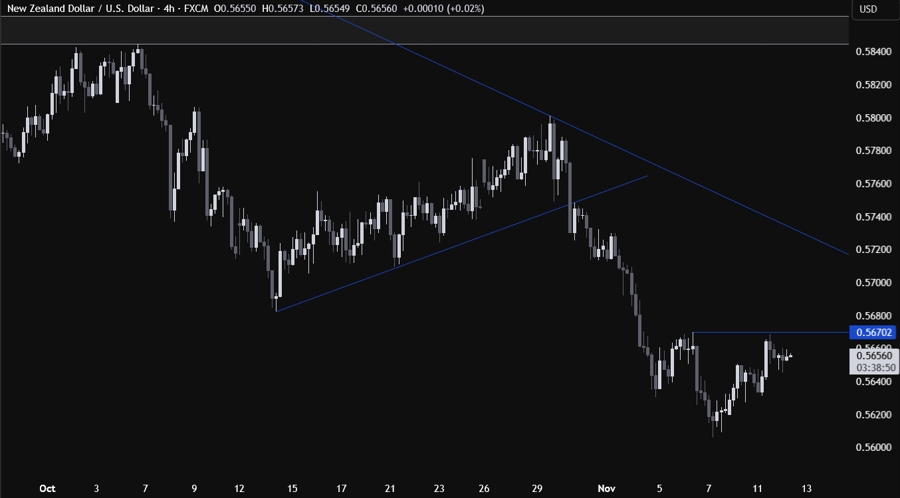
On the 4 hour chart, we can see that we have a key swing high around the 0.5670 level where we got the first rejection. That’s where we can expect the sellers to step in with a defined risk above the swing level to position for a drop into new lows, while the buyers will look for a break higher to increase the bullish bets into the major trendline.
NZDUSD Technical Analysis – 1 hour Timeframe
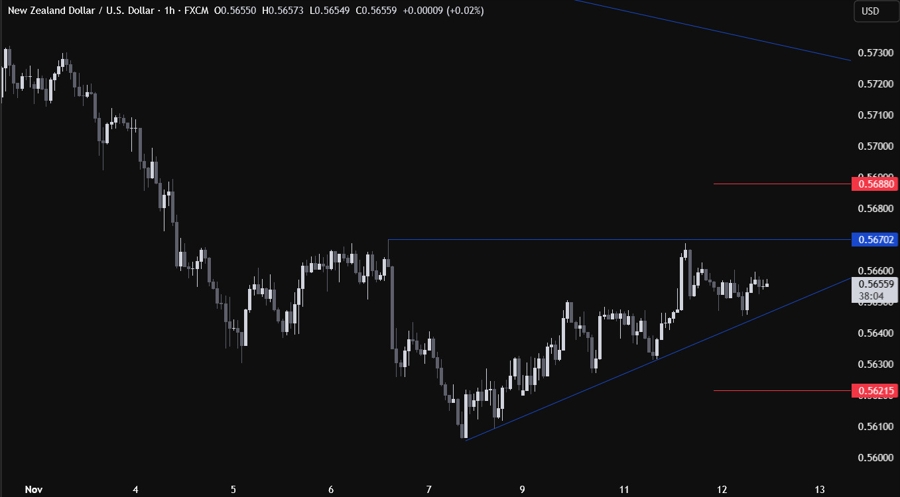
On the 1 hour chart, we can see that we have a minor upward trendline defining the bullish momentum. We can expect the buyers to lean on the trendline to keep pushing into new highs, while the sellers will look for a break lower to increase the bearish bets into new lows. The red lines define the average daily range for today.
