
Fundamental Overview
The USD sold off across the board on Friday as Fed Chair Powell tilted more dovish by saying that “with policy in restrictive territory, the baseline outlook and the shifting balance of risks may warrant adjusting our policy stance.”
That saw traders firming up expectations for a rate cut in September which now stands around 85% probability with a total of 54 bps of easing by year-end. Overall, it’s not the repricing in interest rates expectations that weighed on the greenback but hedges being unwound.
Now, the focus turns to the US NFP report next week which is going to be crucial and will influence greatly interest rates expectations. Strong data might take the probability for a September cut towards a 50/50 chance but will certainly see a more hawkish repricing further down the curve. Soft data, on the other hand, will likely see traders increasing the dovish bets with a third cut by year-end being priced in.
On the NZD side, the RBNZ delivered a more dovish than expected cut as it projected two more rate cuts and the minutes showed that not only a 50 bps cut was actively discussed but two members did vote for it. The NZD got sold off across the board following the decision but of course most of the losses were then erased due to the dovish Powell’s tilt.
NZDUSD Technical Analysis – Daily Timeframe
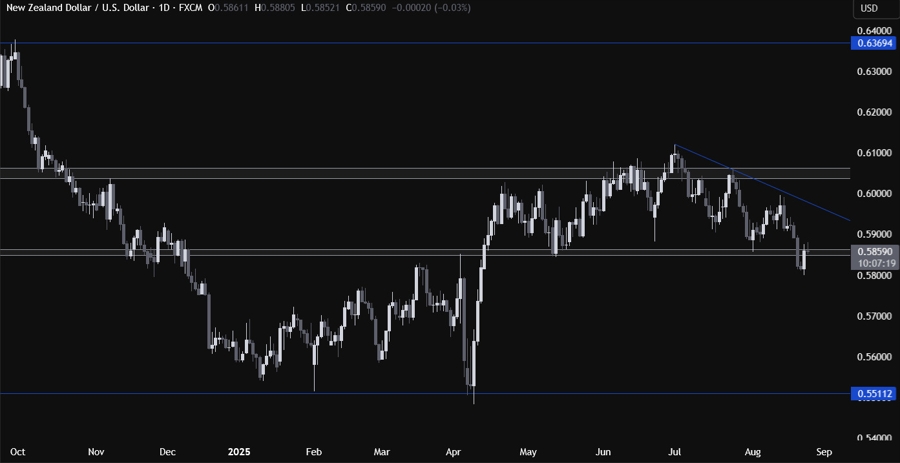
On the daily chart, we can see that the NZDUSD pulled back into the key 0.5850 zone following Powell’s dovish tilt. This is where we can expect the sellers to step in with a defined risk above the zone to position for a drop into new lows. The buyers, on the other hand, will look for a break higher to increase the bullish bets into the major trendline around the 0.5970 level.
NZDUSD Technical Analysis – 4 hour Timeframe
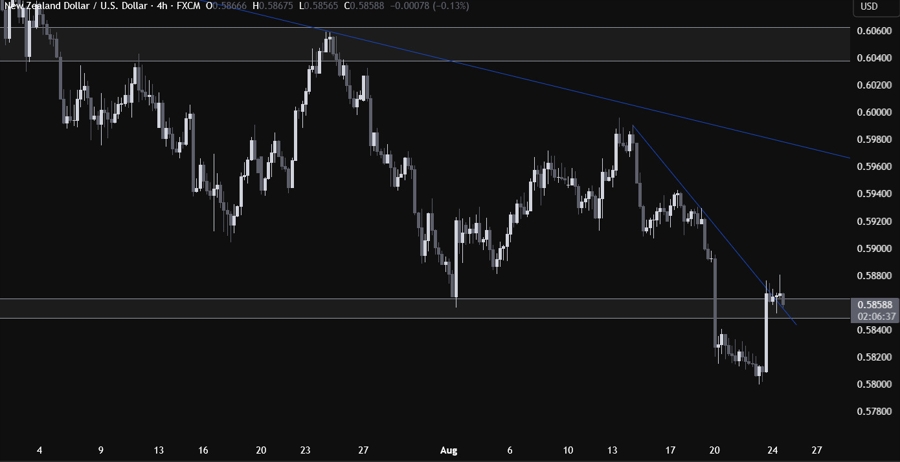
On the 4 hour chart, we can see that we had also a downward trendline acting as resistance around the 0.5850 zone. Technically, this should signal more upside to come but it could also turn into a fakeout. Nonetheless, the buyers will likely pile in around these levels to keep targeting new highs, while the sellers will look for the price to fall below the zone to start positioning for new lows.
NZDUSD Technical Analysis – 1 hour Timeframe
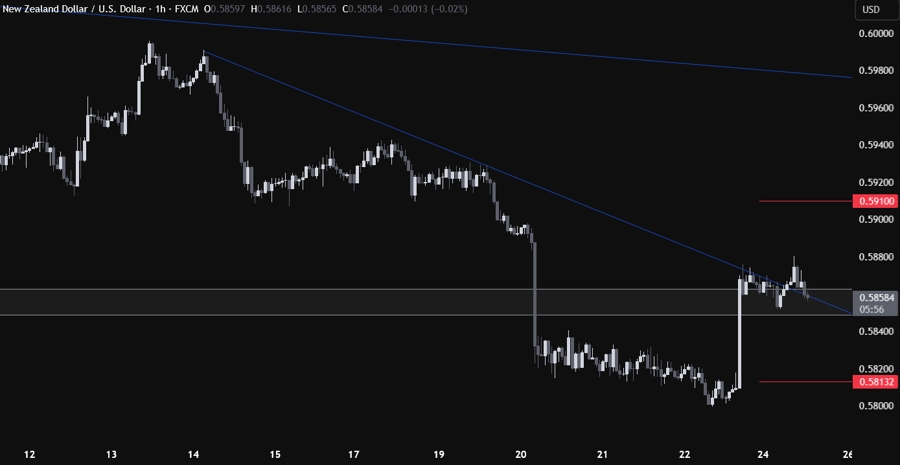
On the 1 hour chart, there’s not much else we can add here as the buyers will look for a rally from the zone, while the sellers will look for a drop below the 0.5850 level to pile into new lows. The red line define the average daily range for today.
Upcoming Catalysts
Tomorrow we have the US Consumer Confidence report. On Thursday, we get the latest US Jobless Claims figures. On Friday, we conclude the week with the US PCE price index.
