
Fundamental Overview
The USD weakened across the board recently following soft ADP data and a Bloomberg report saying that Hassett emerged as the frontrunner for the Fed Chair position.
The greenback was already under some pressure caused by Fed’s Williams endorsement for a December cut last Friday. The probability for a December cut is now at 76%, which generally makes it a done deal.
We won’t get much data before the FOMC meeting, so the focus will likely be mainly on jobless claims and ADP data, which haven’t been showing any strong improvement. Weak data should keep weighing on the greenback, while strong data could provide some short-term support. At the end of the day though, it’s all about the FOMC decision now and the following NFP and CPI reports.
On the NZD side, the RBNZ cut the OCR to 2.25% as expected and signalled the end of the easing cycle. The central bank indicated that the OCR would remain at the current level through 2026. This gave the New Zealand dollar a boost as the market priced out the expected easing in 2026.
NZDUSD Technical Analysis – Daily Timeframe
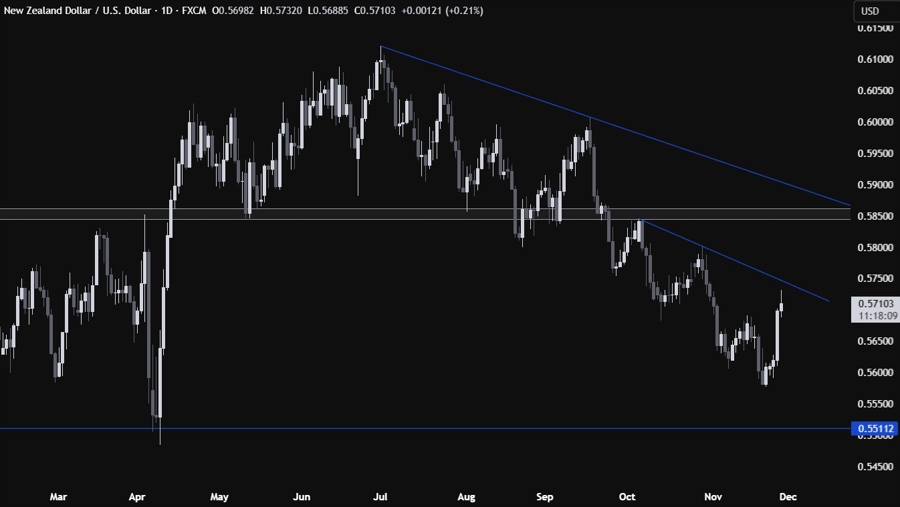
On the daily chart, we can see that the NZDUSD rebounded strongly from the lows following renewed dovish Fed bets and the RBNZ decision. We can see that we have a downward trendline that could act as resistance. The sellers will likely lean on the trendline with a defined risk above it to position for a drop into the April lows. The buyers, on the other hand, will look for a break higher to increase the bullish bets into the 0.5850 resistance next.
NZDUSD Technical Analysis – 4 hour Timeframe
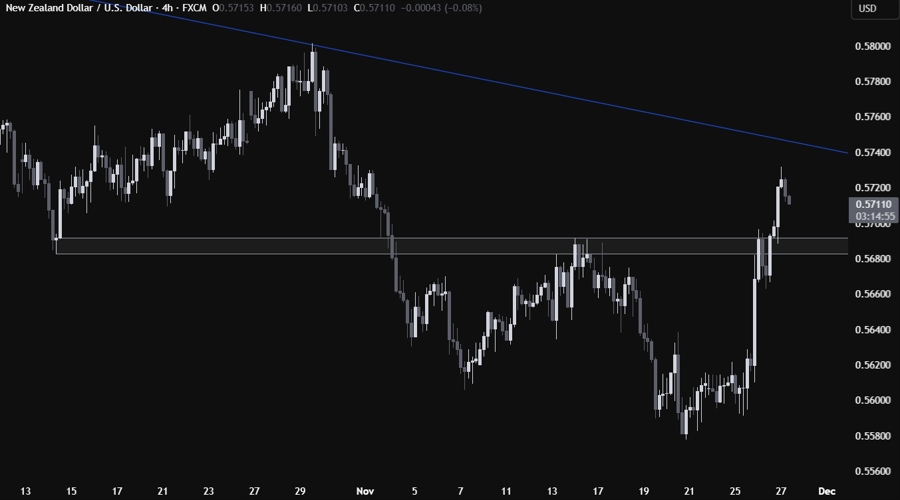
On the 4 hour chart, we can see that we have a strong support zone around the 0.5690 level. If we get a pullback, we can expect the buyers to step in there with a defined risk below the support to position for a break above the trendline. The sellers, on the other hand, will look for a break lower to increase the bearish bets into new lows.
NZDUSD Technical Analysis – 1 hour Timeframe
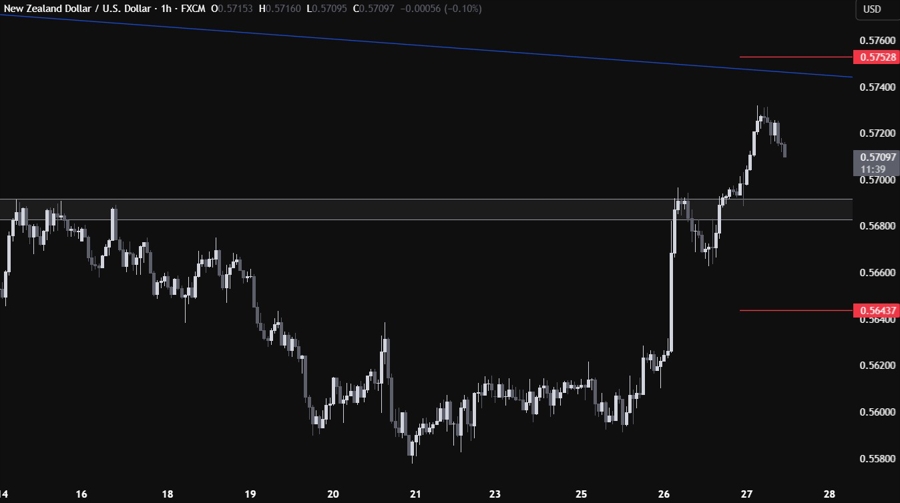
On the 1 hour chart, there’s not much we can add here as the buyers will look for a bounce around the support, while the sellers will look for a break. The red lines define the average daily range for today.
