
Fundamental Overview
The USD extended the losses yesterday following dovish comments from Fed’s Kashkari as he basically got in line with other members for a rate cut in September. This change of heart was triggered by the softer than expected NFP report last Friday.
Overall, the data wasn’t as bad as one might think by just looking at the reaction but given that we were positioned for a strong report and the pricing got more hawkish after the Fed’s decision, the weaker data was enough to trigger a quick repricing.
In fact, the market is now pricing 60 bps of easing by year-end compared to just 35 bps before the NFP release. It’s highly likely that more benign data will see Fed Chair Powell opening the door for a cut in September at the Jackson Hole Symposium.
Nonetheless, the ISM Services PMI this week showed a new high in the prices index and the US jobless claims today could trigger a rethink on the actual softness of the labour market in case we get strong data. Of course, weak figures will just solidify market’s expectations and weigh on the greenback further.
On the NZD side, the labour market report came mostly in line with expectations and didn’t change much for the RBNZ pricing. The market still expects around 40 bps of easing by year-end with 87% probability of a cut at the upcoming meeting.
NZDUSD Technical Analysis – Daily Timeframe
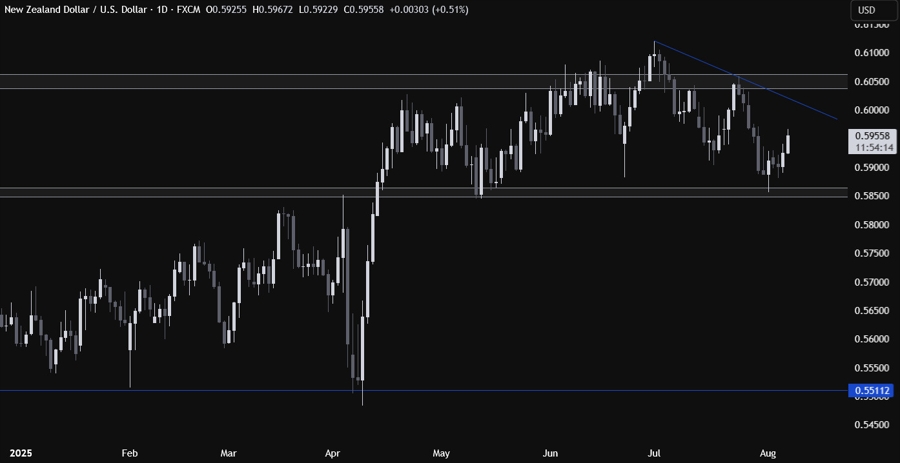
On the daily chart, we can see that NZDUSD bounced from the key 0.5850 support zone following the soft NFP report. The target for the buyers should be the downward trendline around the 0.6020 level. That’s where we can expect the sellers to step in with a defined risk above the trendline to position for a drop back into the key support.
NZDUSD Technical Analysis – 4 hour Timeframe
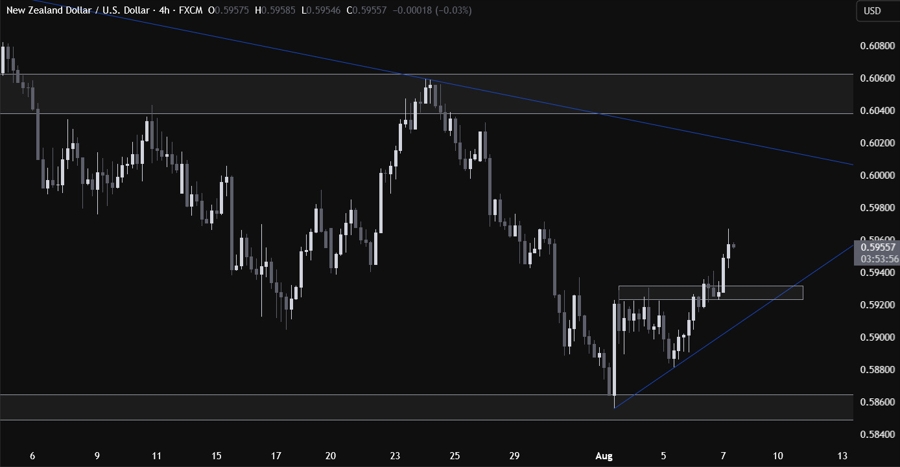
On the 4 hour chart, we can see that we have an upward trendline defining the bullish momentum. If the price were to pull back into the trendline, we can expect the buyers to lean on it to position for a rally into the major downward trendline. The sellers, on the other hand, will look for a break lower to increase the bearish bets into the key support zone.
NZDUSD Technical Analysis – 1 hour Timeframe
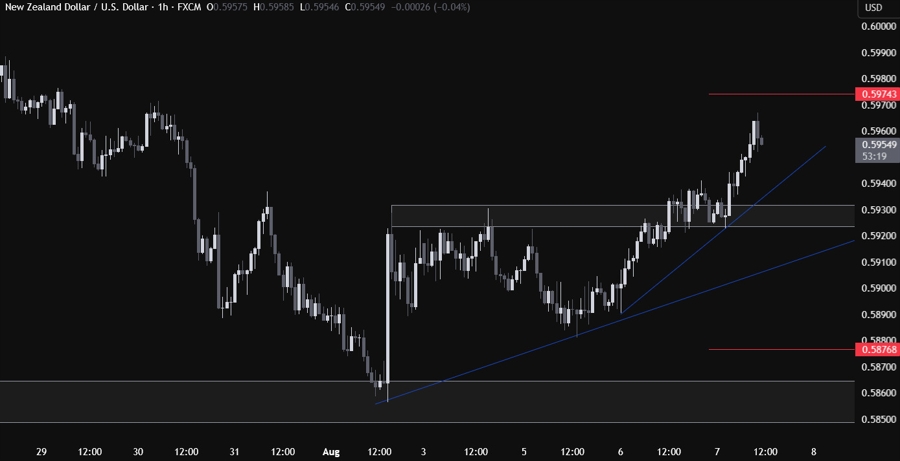
On the 1 hour chart, we can see that we have another minor trendline that could act as support for the buyers. The sellers, on the other hand, will look for downside breakout to keep targeting new lows. We can also see that the price is now trading near the upper bound of the average daily range for today. We can generally see pullbacks from such levels and in any case, the buyers would be better off stepping in around the trendlines from a risk/reward perspective.
Upcoming Catalysts
Today we get the latest US Jobless Claims figures.

