
Fundamental Overview
The USD came under some renewed pressure following the US CPI report. The data was mostly in line with forecasts and not strong enough to deter the market from expecting a cut in September.
In fact, the pricing actually increased to 60 bps of easing by year-end compared to 57 bps before the CPI release. This just shows that the market is now very confident on a September cut and fully prices in at least another one before the end of the year.
A September cut looks unavoidable now and only a hot NFP report in September might get us to a 50% probability, although it would certainly diminish expectations for rate cuts after the September one. For August, we have now just Fed Chair Powell’s speech at the Jackson Hole Symposium as the next major event. Traders will be eager to see if he changes his stance as well.
On the NZD side, nothing has changed fundamentally and we haven’t got any notable data other than the labour market report last week which came mostly in line with expectations and didn’t change much for the RBNZ pricing. The market still expects around 42 bps of easing by year-end with 94% probability of a cut at the upcoming meeting.
NZDUSD Technical Analysis – Daily Timeframe
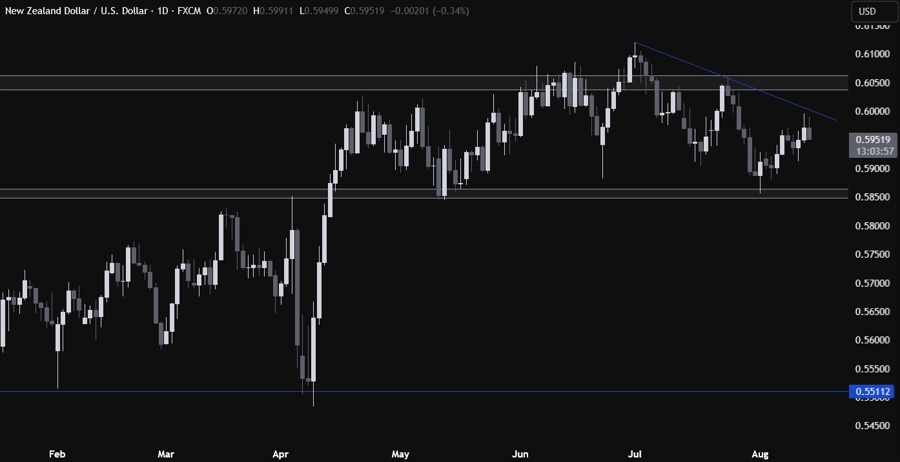
On the daily chart, we can see that NZDUSD extended the gains recently following the US CPI report and pulled back just before hitting the major trendline around the 0.60 handle. If we get another rally, we can expect the sellers to step in around the trendline with a defined risk above it to position for a drop into the key 0.5850 support zone.
NZDUSD Technical Analysis – 4 hour Timeframe
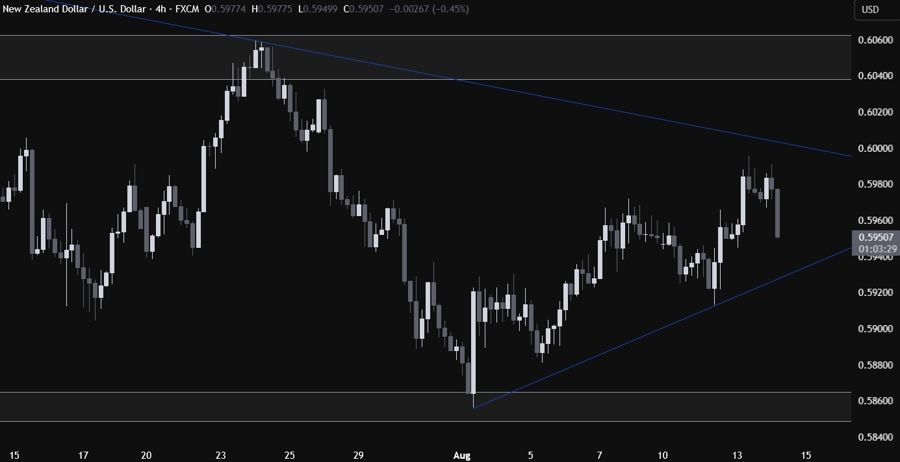
On the 4 hour chart, we can see that we have an upward trendline defining the bullish momentum. If the price gets there, we can expect the buyers to lean on it to position for a rally into the major downward trendline. The sellers, on the other hand, will look for a break lower to pile in for a drop into the key support zone.
NZDUSD Technical Analysis – 1 hour Timeframe
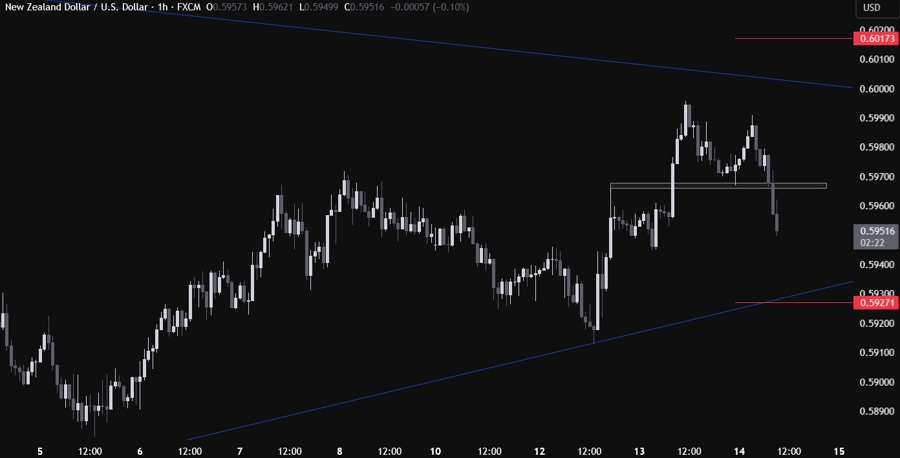
On the 1 hour chart, we can see that we have a minor resistance zone around the 0.5965 level. If we were to get a pullback, the sellers will likely step in there with a defined risk above the resistance to position for a drop into the upward trendline. The buyers, on the other hand, will look for a break higher to pile in for a rally into the major downward trendline next. The red line define the average daily range for today.
Upcoming Catalysts
Today we get the US PPI and the US Jobless Claims figures. Tomorrow, we conclude the week with the US Retail Sales and the University of Michigan Consumer Sentiment report.


