
Fundamental Overview
The USD has been weakening across the board since Tuesday when some comments from USTR Greer suggested that de-escalation was still the base case. The fall in Treasury yields has also been a bearish driver for the greenback as the dovish interest rate expectations increased.
Domestically, nothing has changed for the US dollar as the US government shutdown continues to delay many key US economic reports. The dollar “repricing trade” needs strong US data to keep going, especially on the labour market side, so any hiccup on that front is likely to keep weighing on the greenback.
The BLS announced last week that despite the shutdown, it will release the US CPI report on October 24, so that’s going to be a key risk event. That will need to be seen in the context of US-China relations at that time though. If things go south on that front, then the CPI will not matter much as growth fears will trump everything else.
On the NZD side, the RBNZ cut by 50 bps at the last meeting bringing the OCR to 2.5%, which is the lower bound of their estimated neutral range (2.5%-3.5%). They kept an easing bias though as they are trying to “feel their way” as RBNZ’s Conway recently said.
On Sunday, we have the New Zealand Q3 inflation report and that’s going to be important for them as an upside surprise could give them a reason to skip the November cut. The market is pricing a 92% probability of a 25 bps cut at the November meeting with a total of 39 bps of easing expected by the end of 2026.
NZDUSD Technical Analysis – Daily Timeframe
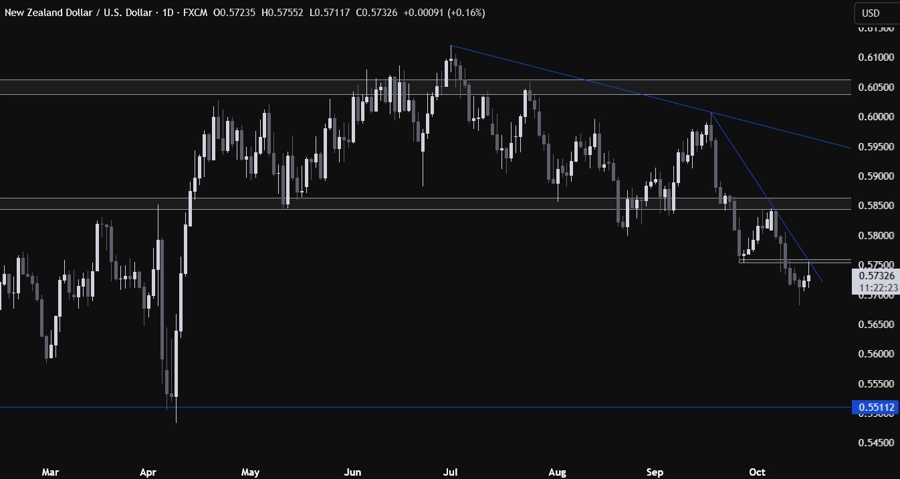
On the daily chart, we can see that the NZDUSD pulled all the way back into a strong resistance zone around the 0.5760 level where we can also find the downward trendline for confluence. The sellers are likely to step in around these levels with a defined risk above the resistance to position for a drop into the 0.56 handle. The buyers, on the other hand, will want to see the price breaking higher to pile in for a rally into the 0.5850 resistance next.
NZDUSD Technical Analysis – 4 hour Timeframe
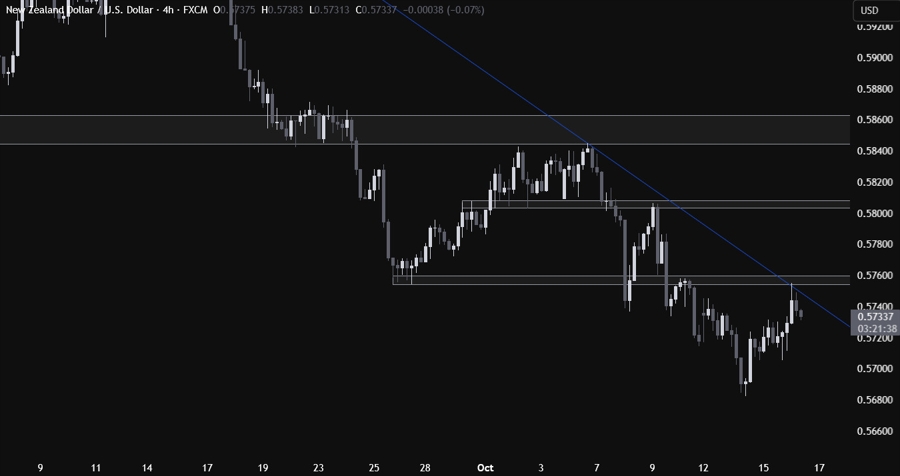
On the 4 hour chart, we can see more clearly the resistance zone around the 0.5760 level and the rejection as the sellers started to step in. There’s not much else we can add here as the sellers will continue to pile in around these levels, while the buyers will look for a break higher to extend the pullback into the 0.5850 resistance next.
NZDUSD Technical Analysis – 1 hour Timeframe
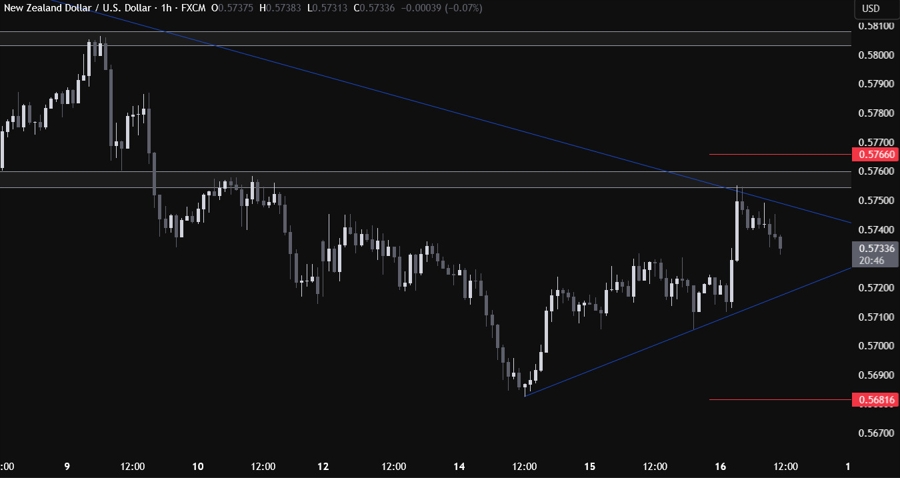
On the 1 hour chart, we can see that we have an upward trendline defining the current pullback. If the price falls into the trendline, we can expect the buyers to lean on it with a defined risk below it to position for a break above the resistance zone. The sellers, on the other hand, will want to see the price breaking lower to increase the bearish bets into the 0.56 handle next. The red lines define the average daily range for today.
Upcoming Catalysts
We don’t have anything on the data front for the rest of the week with the focus remaining solely on US-China headlines. Note that the New Zealand Q3 inflation report will be released on Sunday at 21:45 GMT.


