
KEY POINTS:
- USD continues to bounce around as traders await the US NFP report
- US data has been mixed, macro outlook remains unchanged
- NZD bias still neutral given the lack of key economic reports
- RBNZ expected to deliver a rate hike by the end of the year
FUNDAMENTAL OVERVIEW
USD:
The US dollar has been bouncing around in the past few days as traders continue to wait for the US NFP report. The US data this week has been mixed. We got a soft ISM Manufacturing PMI on Monday but a strong Services PMI yesterday. The ADP was good despite a slight miss, but Job Openings were soft.
In terms of macro, nothing has changed. The market is still pricing 62 bps of easing by year-end with 57% probability of a Fed cut coming in March at the earliest. We will need very soft NFP and CPI data to force the Fed to cut at the upcoming meeting, otherwise traders will just adjust the timing of the expected cuts in 2026 and might even increase bets in the case of weak data.
Tomorrow, the US Supreme Court scheduled an “opinion day”, so we might also potentially get a decision on Trump’s tariffs.
NZD:
On the NZD side, the RBNZ cut the OCR to 2.25% as expected at the last policy meeting and signalled the end of the easing cycle. The central bank indicated that the OCR would remain at the current level through 2026.
This gave the New Zealand dollar a boost as the market priced out the expected easing 2026 and priced in the possibility of a rate hike as the next move. We haven’t got any key economic report out of New Zealand in the meantime, so the outlook remains neutral.
NZDUSD TECHNICAL ANALYSIS – DAILY TIMEFRAME
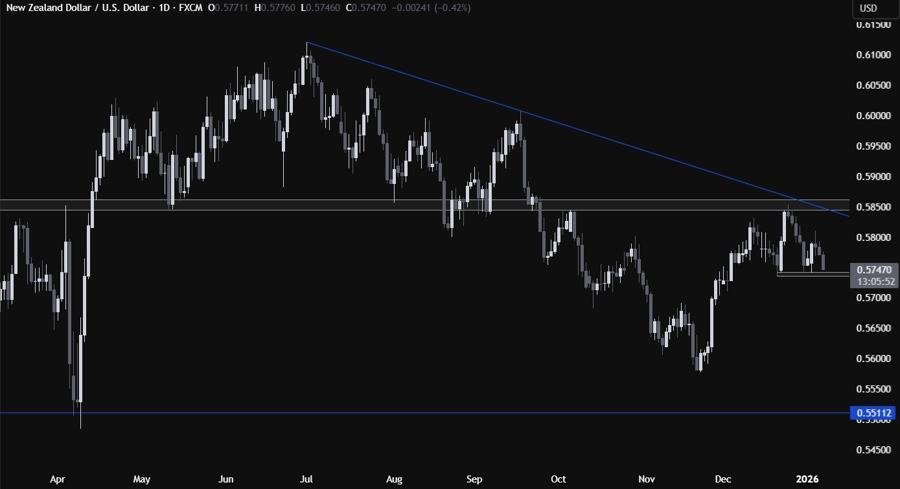
On the daily chart, we can see that the NZDUSD has a nice rally following the RNBZ decision back in November. The key resistance zone around the 0.5850 level stalled the momentum though and we started to consolidate awaiting new catalysts.
We have a strong support zone around the 0.5740 level where we can expect the buyers to step in with a defined risk below the support to position for a break above the key resistance. The sellers, on the other hand, will want to see the price breaking lower to open the door for new lows and target the 0.5500 handle next.
NZDUSD TECHNICAL ANALYSIS – 4 HOUR TIMEFRAME
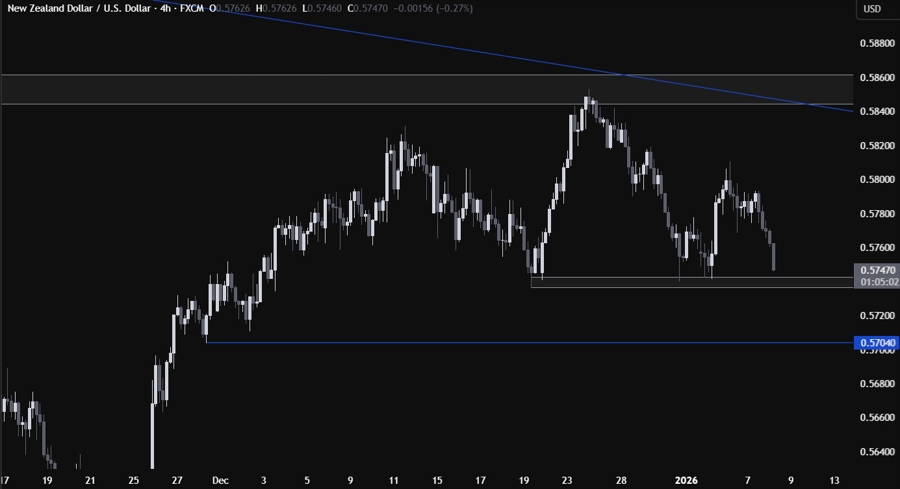
On the 4 hour chart, we can see more clearly the recent price action with the support zone around the 0.5740 level limiting the downside. A break should open the door for new lows, with the 0.57 handle as the first target. The buyers will continue to step in around the support, while the sellers will wait for a break.
NZDUSD TECHNICAL ANALYSIS – 1 HOUR TIMEFRAME
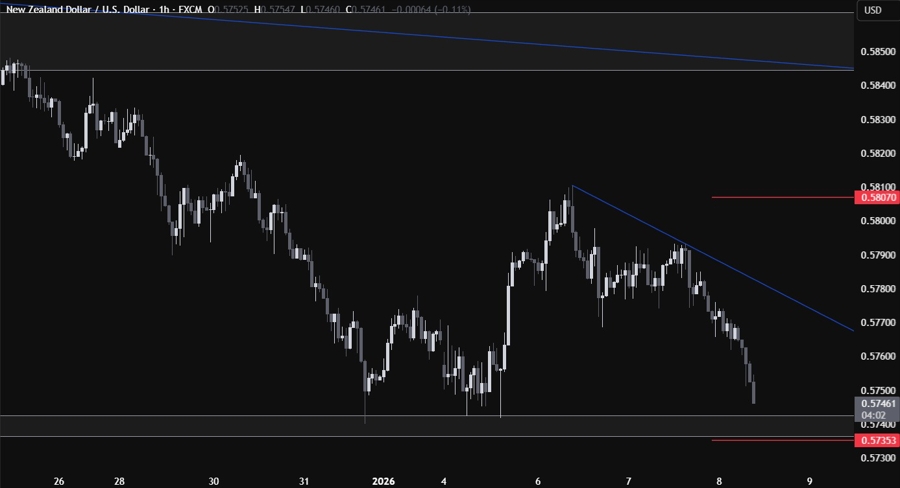
On the 1 hour chart, we can see that we have a minor downward trendline defining the recent pullback into the support. If the price bounces and rallies into the trendline, we can expect the sellers to lean on the trendline with a defined risk above it to keep pushing for a break below the support. The buyers, on the other hand, will look for a break higher to increase the bullish bets into the 0.5850 resistance next. The red lines define the average daily range for today.
UPCOMING CATALYSTS
Today we get the latest US Jobless Claims figures. Tomorrow, we conclude the week with the US NFP report and potential US Supreme Court decision on Trump’s tariffs.


