
Fundamental Overview
The USD weakened across the board on the Fed’s decision but eventually erased all the losses and increased the gains as traders digested all the information and realised the projected rate path was more hawkish than market’s pricing.
In fact, the dot plot showed that the FOMC projected two more rate cuts for 2025 by a narrow majority, with the rest of officials expecting just one more or even none. Moreover, the Fed projected just one cut in 2026 compared to three that the market was pricing before the decision.
Fed Chair Powell then labelled the rate cut as a “risk management” action given the weakening in the labour market data. But overall, he sounded pretty neutral even though he understandably placed more emphasis on the labour market given the two consecutive soft NFP reports.
The day after the FOMC decision, we got solid US jobless claims report, and the greenback increased the gains further. Looking forward, it’s going to be all about the data. Strong data will likely trigger a hawkish repricing in interest rates expectations and support the greenback. On the other hand, weak data will likely continue to weigh on it.
On the NZD side, the RBNZ delivered a more dovish than expected cut at the last meeting as it projected two more rate cuts and the minutes showed that not only a 50 bps cut was actively discussed but two members did vote for it. Last week, we got a big downside surprise in the New Zealand GDP data and the NZD sold off as the market started to price in higher chances of a 50 bps cut at the upcoming meeting.
NZDUSD Technical Analysis – Daily Timeframe
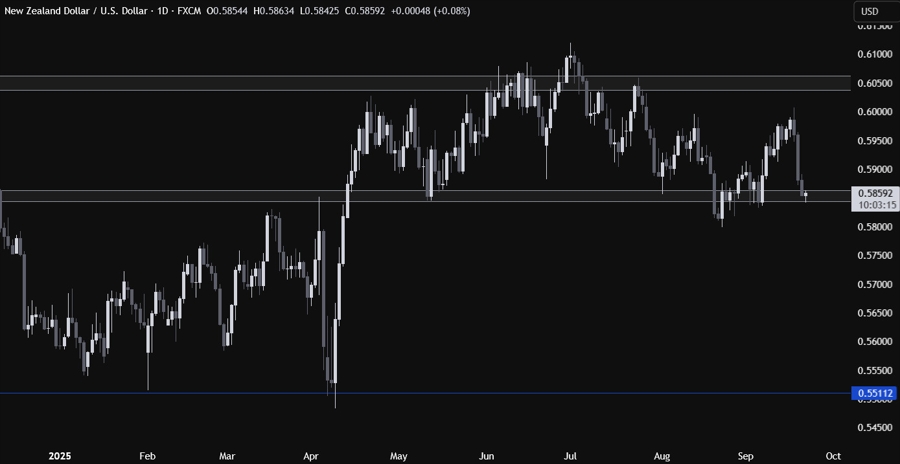
On the daily chart, we can see that the NZDUSD dropped all the way back to the key 0.5850 support zone. This is where the buyers are now stepping in with a defined risk below the support to position for a rally into the 0.6050 resistance. The sellers will want to see the price breaking lower to increase the bearish bets into the 0.57 handle next.
NZDUSD Technical Analysis – 4 hour Timeframe
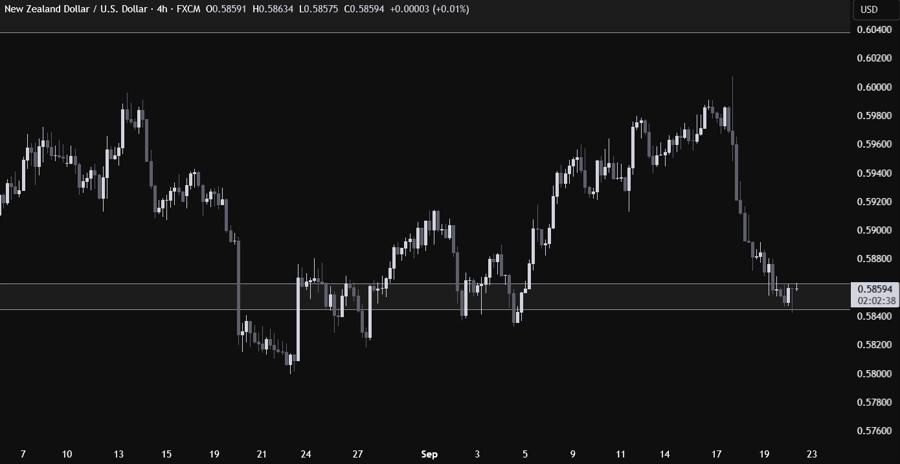
On the 4 hour chart, we can see more clearly the recent selloff that began with the FOMC decision and eventually increased the momentum following the weak New Zealand GDP data. There’s not much we can glean from this timeframe, so we need to zoom in to see some more details.
NZDUSD Technical Analysis – 1 hour Timeframe
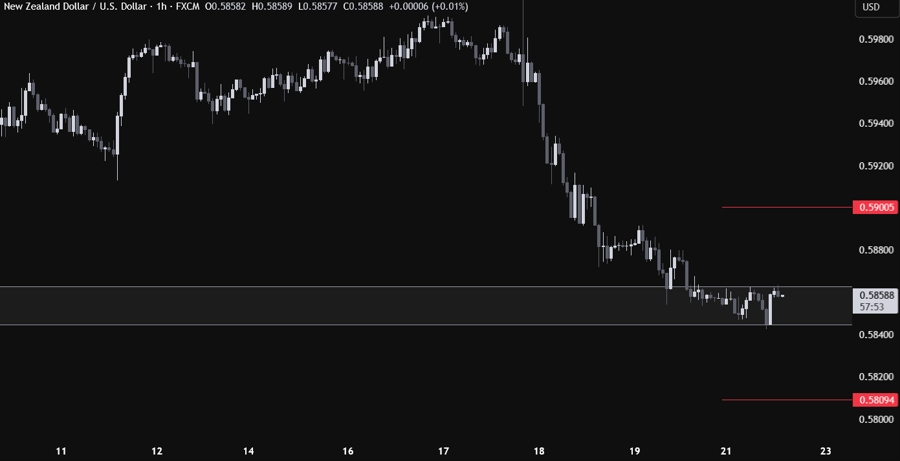
On the 1 hour chart, we can see that the bearish momentum has been waning as the price approached the key support zone. We now have a very tight range between the 0.5863 resistance and the 0.5843 support. The buyers will look for an upside breakout to target a pullback into the 0.59 handle, while the sellers will want to see the price breaking lower to extend the selloff into the 0.57 handle next. The red line define the average daily range for today.
Upcoming Catalysts
Tomorrow we have the US Flash PMIs, as well as Fed Chair Powell speaking. On Thursday, we get the latest US Jobless Claims figures. On Friday, we conclude the week with the US PCE report. Keep also an eye on Fed speakers this week.


