Fundamental Overview
The USD rise stalled last week as the US government shutdown delayed many key US economic reports. The dollar “repricing trade” needs strong US data to keep going, especially on the labour market side, so any hiccup on that front is likely to keep weighing on the greenback. The market pricing is now back to 45 bps of easing by year-end and 110 bps by the end of 2026. This could still be too dovish, but we will need strong data to reprice.
In the absence of the government data, an October rate cut is now seen as a done deal. The reality is that an October cut was never really in question. It’s the December cut that could be priced out in case the data strengthens. We still have three NFP and two CPI reports before the December meeting.
The greenback erased all the gains triggered by last week’s data in the meantime as we are likely experiencing a pullback after a very strong rally. Other possible reasons include the government shutdown fears and quarter-end flows.
On the NZD side, the RBNZ is expected to cut by 50 bps tomorrow (55% probability) and bring the OCR to 2.5%, which is the lower bound of their estimated neutral range (2.5%-3.5%). The New Zealand dollar weakened sharply following a 0.9% contraction in the Q2 GDP report which was much bigger than the RBNZ’s -0.3% projection.
Given that the central bank is focused on spare capacity as a reason to cut more aggressively, traders priced increased the bets for a 50 bps cut. The market is pricing 61 bps of easing by year-end and 77 bps cumulatively by the end of 2026. Whether the RBNZ cuts by 25 or 50 bps, it will retain an easing bias and focus on the next quarterly CPI report.
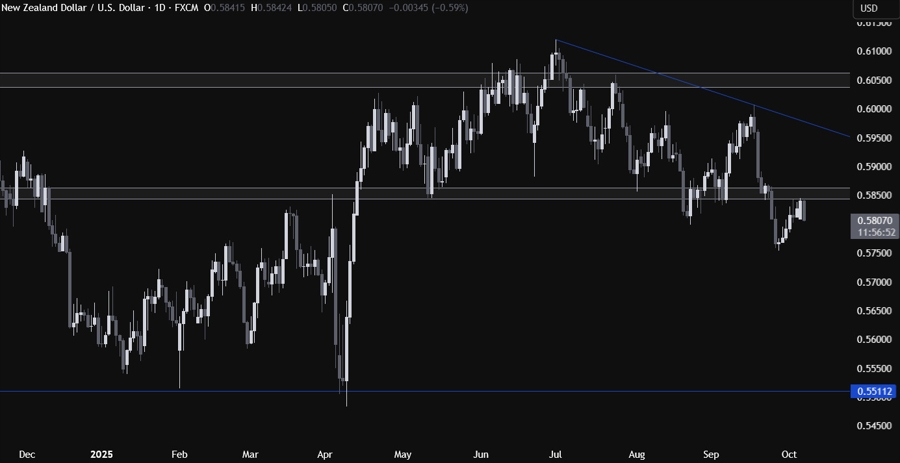
NZDUSD Technical Analysis – Daily Timeframe

On the daily chart, we can see that the NZDUSD pulled all the way back to the key 0.5850 resistance zone. The sellers will likely continue to step in around the resistance with a defined risk above it to position for a drop into new lows. The buyers, on the other hand, will look for a break higher to pile in for a rally into the major trendline around the 0.5950 level.
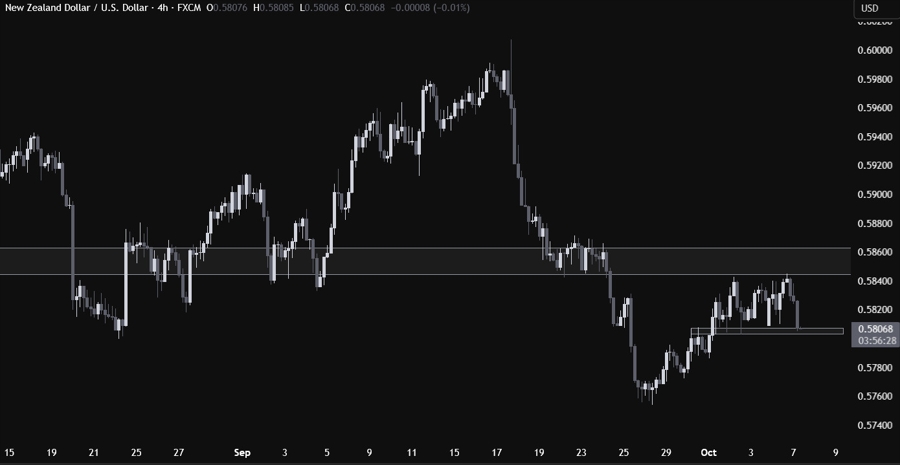
NZDUSD Technical Analysis – 4 hour Timeframe

On the 4 hour chart, we can see that we have a minor support zone around the 0.58 handle. This is where we can expect the buyers to step in with a defined risk below the support to position for a break above the key resistance. The sellers, on the other hand, will want to see the price breaking lower to increase the bearish bets into new lows.
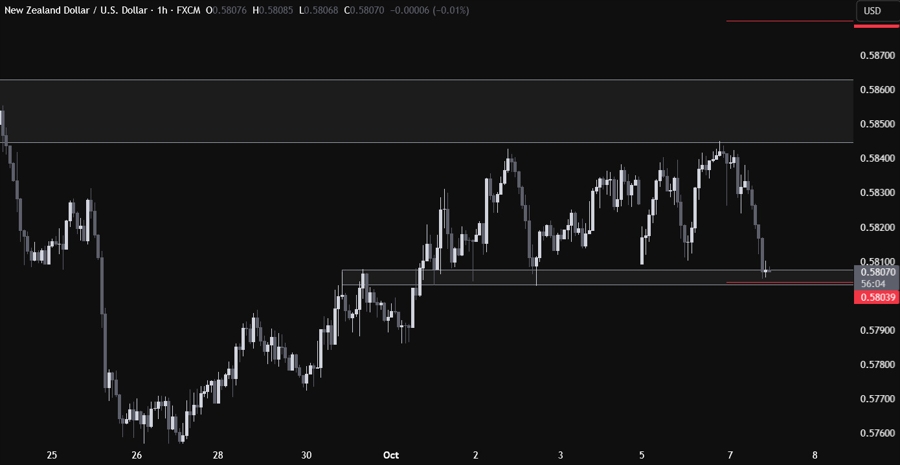
NZDUSD Technical Analysis – 1 hour Timeframe

On the 1 hour chart, there’s not much else we can add here as the pair got stuck in a range with traders waiting for new catalysts. We can see though that the price is now both at the support zone and the lower bound of the average daily range for today (red line). This should technically limit the downside for today and give the buyers some conviction to pile in around these levels into the RBNZ decision.
Upcoming Catalysts
Tomorrow we have the RBNZ policy announcement. On Thursday, we have Fed Chair Powell speaking and the US Jobless Claims (if the shutdown is lifted). On Friday, we conclude the week with the University of Michigan Consumer Sentiment report.

