
FUNDAMENTAL OVERVIEW
USD:
Last week, we got a hot US NFP report and slightly soft US CPI data. The market firmed up rate cut bets with 62 bps of easing seen by year-end. Overall, the data doesn’t really point in that direction, but we will need to see more of it to confirm or deny the market pricing.
Given the negligible changes to the big picture after all the data, the US dollar remained mostly rangebound with mixed performance against the major currencies. The future outlook will still be guided by the evolution of the data.
This week, all the important stuff will be released on Friday as we get the US Flash PMIs and the Q4 GDP. We might also get the US Supreme Court decision on Trump's tariffs.
GBP:
On the GBP side, it’s going to be a big week for the pound as we get the most important economic releases. In fact, tomorrow we begin with the UK employment report, followed in the coming days by UK CPI, Flash PMIs, and retail sales data. Given the market pricing, higher than expected data will likely give the pound a boost, while soft figures could weigh on the currency.
As a reminder, the BoE surprised with a dovish hold at the last meeting as 4 members dissented for a rate cut versus 2 expected. Moreover, they changed the guidance in the statement from "the bank rate is likely to continue on a gradual downward path" to "the bank rate is likely to be reduced further".
Inflation forecasts were also revised much lower across the board. Lastly, the Agents' Pay Survey showed wage growth to average 3.4% in 2026 vs 3.5% expected. Traders are now pricing a 65% chance of a rate cut at the next meeting already and a total of 48 bps of easing by year-end.
GBPUSD TECHNICAL ANALYSIS – DAILY TIMEFRAME
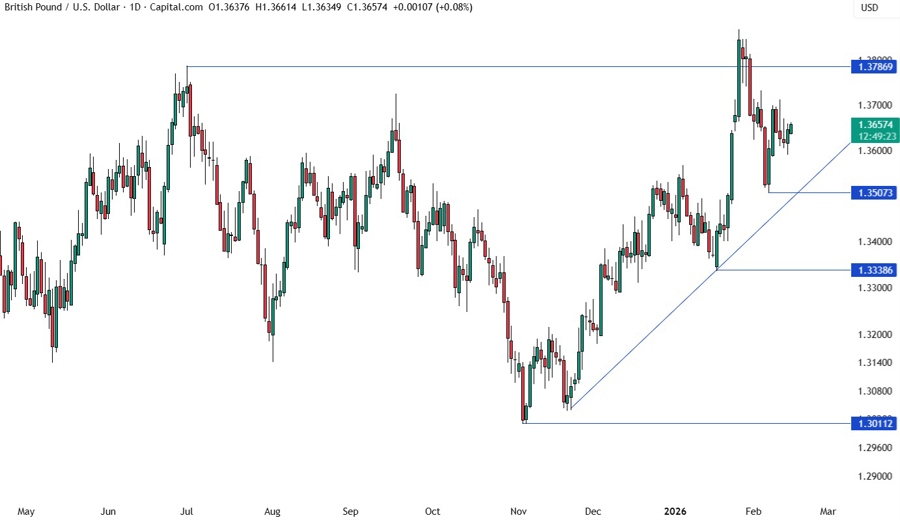
On the daily chart, we can see that GBPUSD couldn’t extend the drop into the major trendline and bounced near the 1.35 handle. We got stuck in a consolidation last week as the US data didn’t change anything in the bigger picture. There’s not much we can glean from this timeframe, so we need to zoom in to see some more details.
GBPUSD TECHNICAL ANALYSIS – 4 HOUR TIMEFRAME
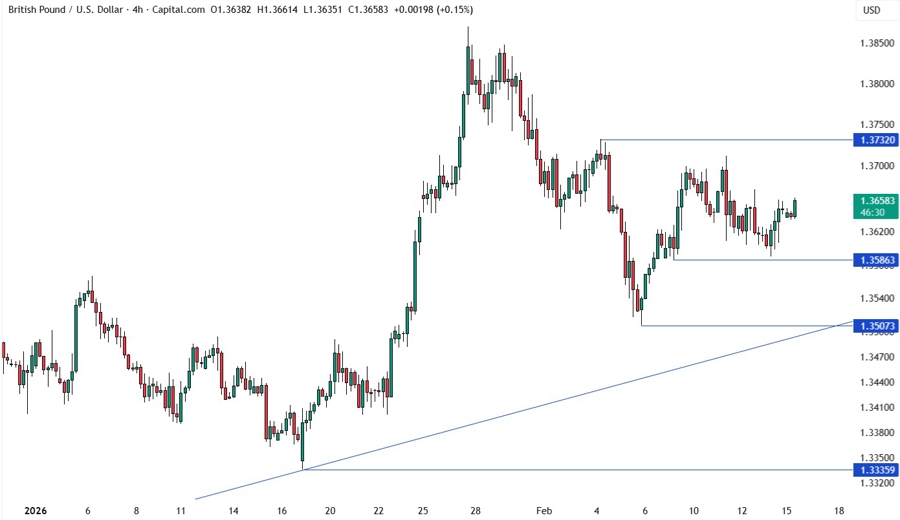
On the 4 hour chart, we can see a few important swing levels. The price bounced around the 1.3586 level which has been defining the rebound into the highs. A break above the 1.3732 level should open the door for a rally into the cycle highs and we can expect the buyers to pile in on the break. The sellers, on the other hand, will likely step in at the 1.3732 level with a defined risk above it to position for a drop into the major trendline.
GBPUSD TECHNICAL ANALYSIS – 1 HOUR TIMEFRAME
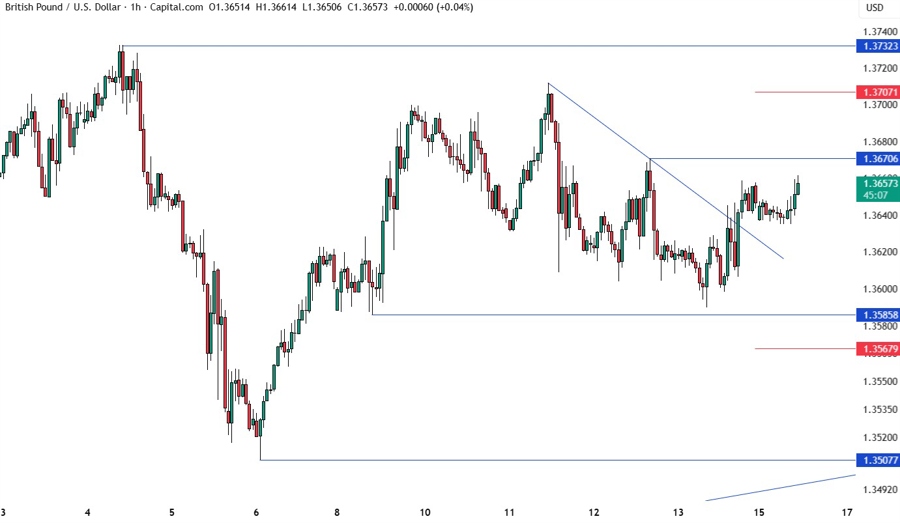
On the 1 hour chart, we can see the price broke above the downward trendline that was defining the bearish momentum on this timeframe. We now have the 1.3670 level that could act as resistance. That’s where we can expect the sellers to step in with a defined risk above the level to position for a drop into the major trendline. The buyers, on the other hand, will look for a break higher to extend the rebound into the 1.3732 level next. The red lines define the average daily range for today.
UPCOMING CATALYSTS
Tomorrow we get the UK employment report. On Wednesday, we have the UK CPI and the FOMC Meeting Minutes. On Thursday, we get the latest US Jobless Claims figures. On Friday, we conclude the week with the UK Retail Sales, the UK Flash PMIs, the US Q4 GDP, the US PCE price index for December, the US Flash PMIs and a potential US Supreme Court decision on Trump’s tariffs.


