
FUNDAMENTAL OVERVIEW
USD:
The US dollar rallied across the board on safe haven demand as US-Iran conflict erupted over the weekend. The main driver though was the market’s realisation that rate cuts might not come as soon as expected.
In fact, higher oil prices will eventually put upward pressure on inflation and Monday’s ISM Manufacturing PMI showed how wrong the market has been in being so dovish on the economy. The data was hot for the second consecutive month, so the one-off narrative was put to rest.
Moreover, the prices index jumped to the highest level since 2022, in another sign that inflationary pressures remain high. Traders pared back their rate cut bets this week with the total easing by year-end now seen around 44 bps vs 58 bps on Friday.
INR:
In the big picture, the Indian Rupee remains on a bearish structural trend against the US dollar. This week, the bearish momentum increased substantially due to strong risk aversion in the markets.
Moreover, supply disruptions through the Strait of Hormuz and a renewed surge in global oil prices led traders to expect a negative impact to the Indian economy. In fact, almost 90% of India’s crude oil requirement is imported and 55% comes from the Middle East.
A de-escalation could give the INR a boost in the short-term which will likely be a good opportunity for traders to buy the dip in the USDINR pair as the main uptrend will likely remain intact.
USDINR TECHNICAL ANALYSIS – DAILY TIMEFRAME
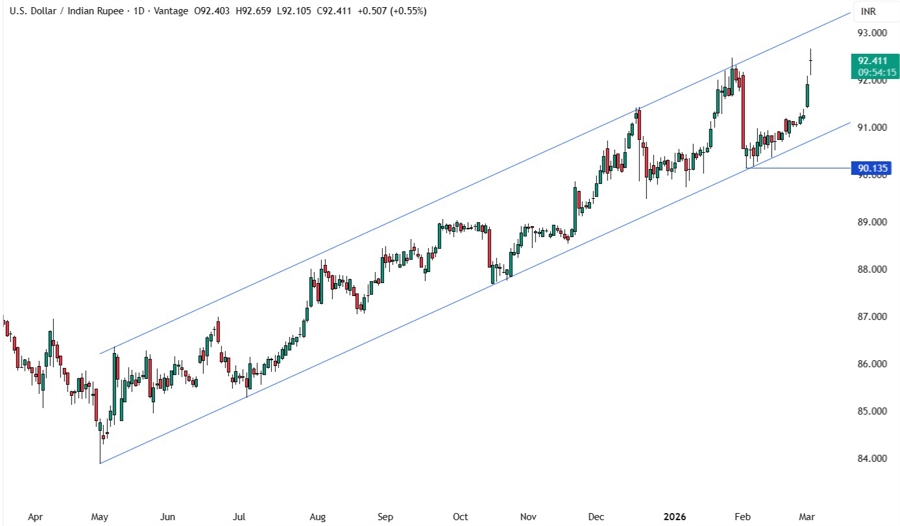
On the daily chart, we can see that USDINR has been creeping up slowly as dip-buyers started to pile in near the lower bound of the channel and exploded this week as the US-Iran war erupted over the weekend. The target remains the top trendline around the 93.00 handle. That’s where we can expect the sellers to step in with a defined risk above the upper bound of the channel to position for a drop back into the bottom trendline. The buyers, on the other hand, will look for a break higher to increase the bullish bets into new highs.
USDINR TECHNICAL ANALYSIS – 4 HOUR TIMEFRAME
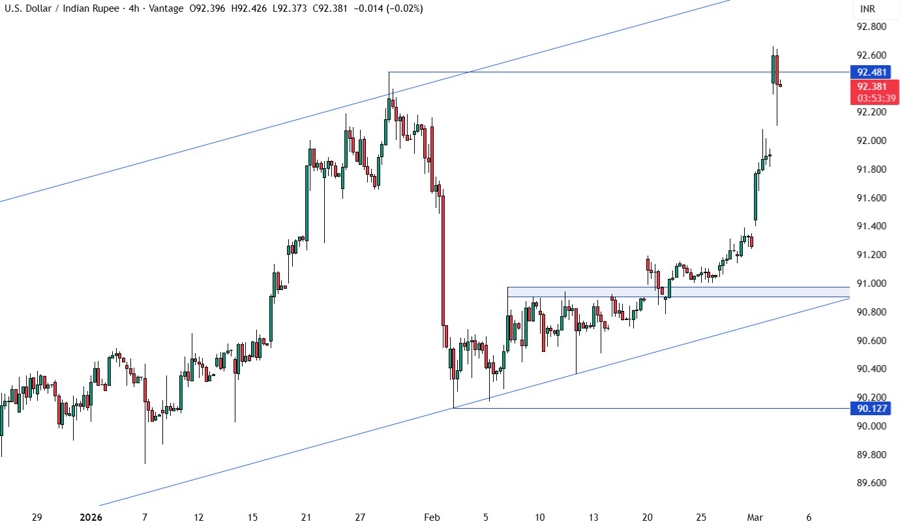
On the 4 hour chart, we can see the price broke through the previous record high today and pulled back as the sellers stepped in. There’s not much we can glean from this timeframe, so we need to zoom in to see some more details.
USDINR TECHNICAL ANALYSIS – 1 HOUR TIMEFRAME
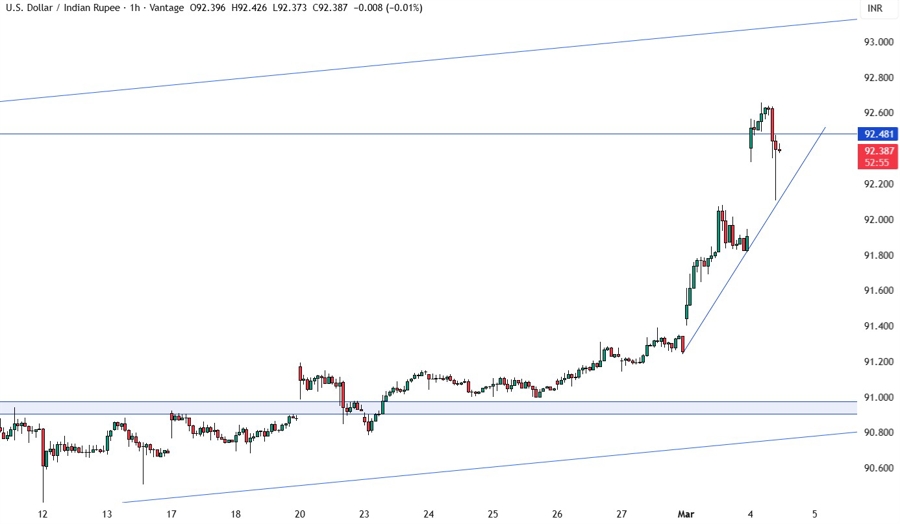
On the 1 hour chart, we can see an upward trendline defining the bullish momentum. The buyers will likely continue to lean on the trendline with a defined risk below it to keep pushing into the 93.00 handle. The sellers, on the other hand, will look for a break lower to pile in for a pullback into the 91.00 handle next.
UPCOMING CATALYSTS
Today we have the US ADP and the US ISM Services PMI. Tomorrow, we get the latest US Jobless Claims figures. On Friday, we conclude the week with the US NFP report. The data might not matter much this week amid the US-Iran conflict though.
