
FUNDAMENTAL OVERVIEW
USD:
The US dollar opened higher today after Israel bombed 30 Iranian fuel depots on Saturday and oil prices surged above 100$ per barrel. The greenback continues to be supported on safe haven demand and the hawkish repricing in interest rate expectations as traders pare back the Fed rate cut bets.
The weak NFP report on Friday was basically ignored as the market focus remains on the US-Iran war. The NFP was also completely the opposite of what the other jobs data have been pointing to, so it’s hard to trust it.
Traders are now laser focused on de-escalation as that would trigger a strong relief rally in risk assets which is likely to weigh on the US Dollar. Trump said on Truth Social that oil prices will drop rapidly when the destruction of the Iran nuclear threat is over.
Reading between the lines it means that once they declare that the nuclear threat is over or that they reached all their goals, it would mark the start of de-escalation and the market will react to it.
INR:
In the big picture, the Indian Rupee remains on a bearish structural trend against the US dollar. Lat week, the bearish momentum increased substantially due to strong risk aversion in the markets amid the US-Iran war. The RBI intervened after the Rupee tumbled to new record lows, but the central bank’s action was once again useless as the currency sank to another record low today.
A de-escalation could give the INR a boost in the short-term which will likely be a good opportunity for traders to buy the dip in the USDINR pair as the main uptrend will likely remain intact.
USDINR TECHNICAL ANALYSIS – DAILY TIMEFRAME
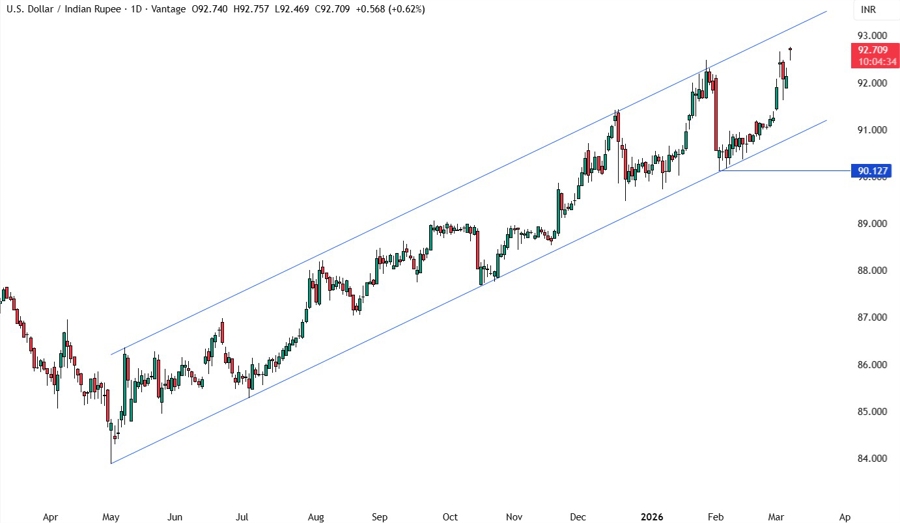
On the daily chart, we can see that USDINR is approaching the upper bound of the rising channel. If the price gets there, we can expect the sellers to step in with a defined risk above the top trendline to position for a drop back into the lower bound of the channel. The buyers, on the other hand, will want to see the price breaking higher to increase the bullish bets into new highs.
USDINR TECHNICAL ANALYSIS – 4 HOUR TIMEFRAME
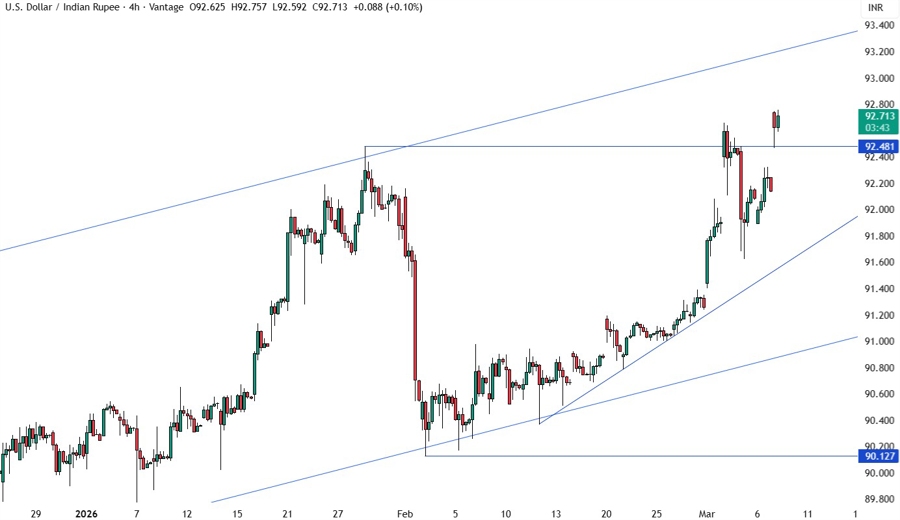
On the 4 hour chart, we have an upward trendline defining the bullish momentum. If we get a pullback into the trendline, we can expect the buyers to lean on it with a defined risk below it to keep pushing into new highs. The sellers, on the other hand, will look for a break lower to extend the pullback into the lower bound of the channel.
USDINR TECHNICAL ANALYSIS – 1 HOUR TIMEFRAME
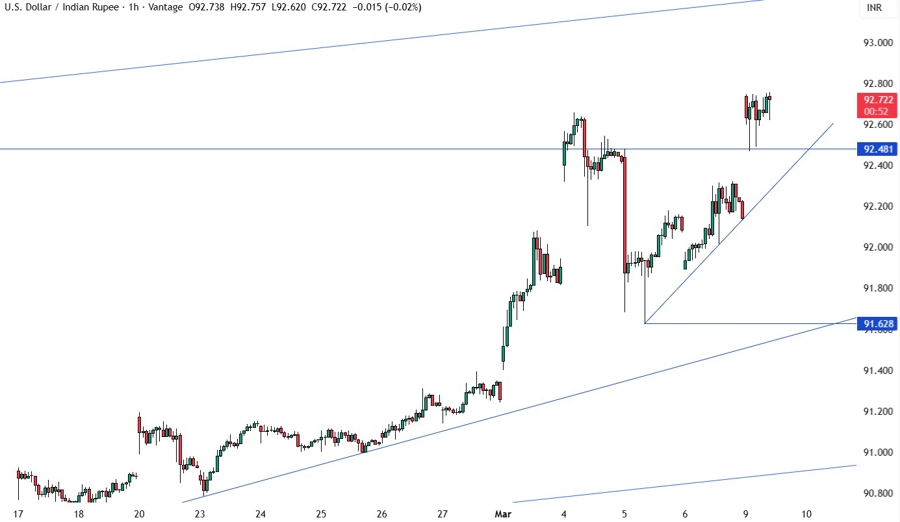
On the 1 hour chart, we have another minor upward trendline defining the bullish momentum on this timeframe. The buyers will likely lean on the trendline with a defined risk below it to keep pushing into new highs, while the sellers will look for a break to extend the pullback into the next trendline around the 91.00 handle.
UPCOMING CATALYSTS
On Wednesday we have the US CPI report. On Thursday, we get Indian CPI report and the latest US Jobless Claims figures. On Friday, we conclude the week with the US PCE price index, the University of Michigan Consumer Sentiment survey and the Job Openings data. As a reminder, the market focus right now is solely on the US-Iran war, so the data might not matter much.
