
FUNDAMENTAL OVERVIEW
USD:
The US Dollar continues to rebound after the strong selloff experienced in the last couple of weeks of January. The greenback remains supported by improving US data with the recent US ISM Manufacturing PMI potentially hinting to stronger economic activity going forward. If the data continues to come out strong, traders will have to pare back their dovish Fed bets, and that’s going to boost the US Dollar.
Today, we have the US ADP and the US ISM Services PMI on the agenda. Surprisingly strong data will likely trigger a hawkish repricing in interest rates expectations and support the greenback. Soft data, on the other hand, could weigh on the greenback in the short-term but it’s unlikely to change much in terms of market pricing.
The main event will be the US NFP report which got delayed due to the partial US government shutdown. We might get the data next week, which is also when we will get the US CPI report. The trend for the dollar is looking increasingly bullish, but traders will still look for confirmation from the data to gain more conviction.
GBP:
On the GBP side, the latest UK Flash PMIs beat expectations by a big margin and triggered a slightly hawkish repricing which gave the pound a boost. The employment and inflation reports, on the other hand, came out basically in line with expectations.
The BoE is expected to hold the Bank Rate steady tomorrow with a 6-3 vote split in favour of no change. There shouldn’t be material changes to the forward guidance as the central bank maintains a data-dependent approach. The focus will be mainly on the updated monetary policy report where a lower revision for inflation or the neutral interest rate could be taken as dovish signals.
GBPUSD TECHNICAL ANALYSIS – DAILY TIMEFRAME
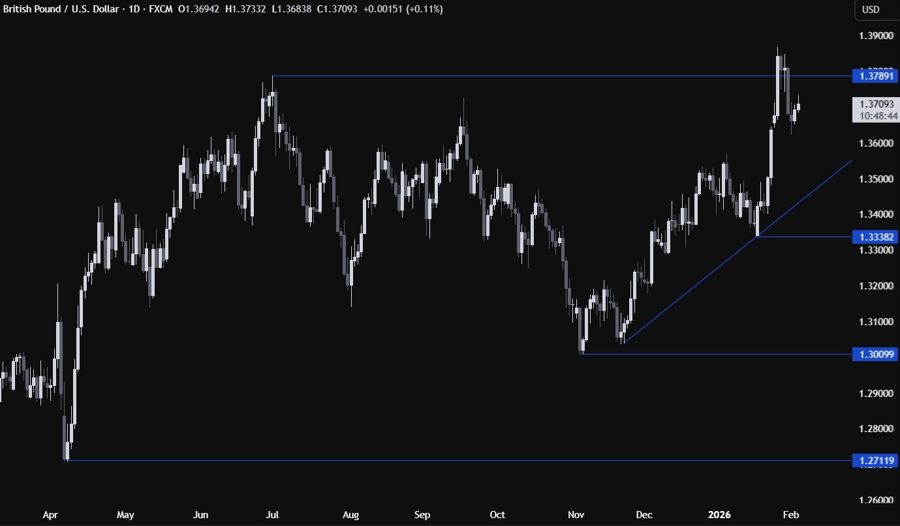
On the daily chart, we can see that GBPUSD probed above the cycle high around the 1.3790 level but eventually fell back below it. The sellers piled in on the false breakout and are now targeting the major trendline around the 1.3500 handle. If the price gets there, we can expect the buyers to lean on the trendline with a defined risk below it to position for a rally into a new cycle high.
GBPUSD TECHNICAL ANALYSIS – 4 HOUR TIMEFRAME
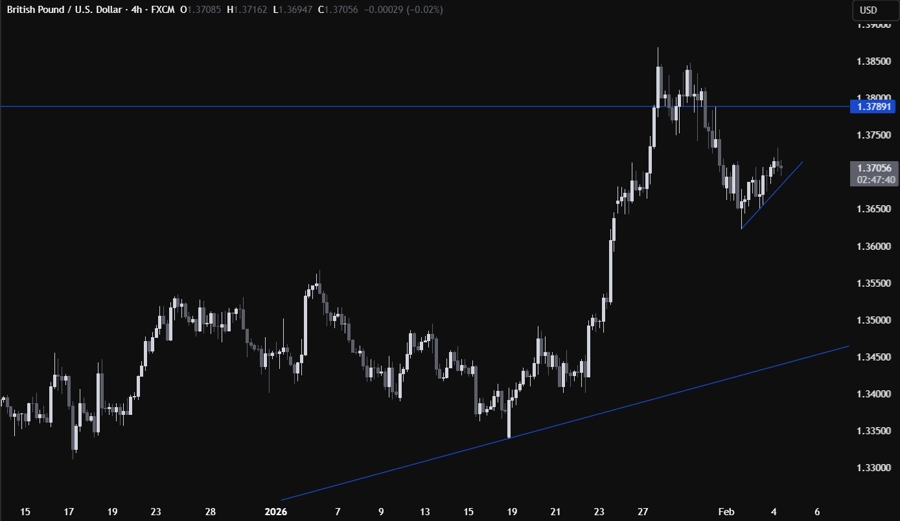
On the 4 hour chart, we can see that we have a minor counter-trendline defining the current pullback. The buyers will likely continue to lean on the trendline with a defined risk below it to keep pushing into new highs, while the sellers will look for a break lower to increase the bearish bets into the major trendline.
GBPUSD TECHNICAL ANALYSIS – 1 HOUR TIMEFRAME
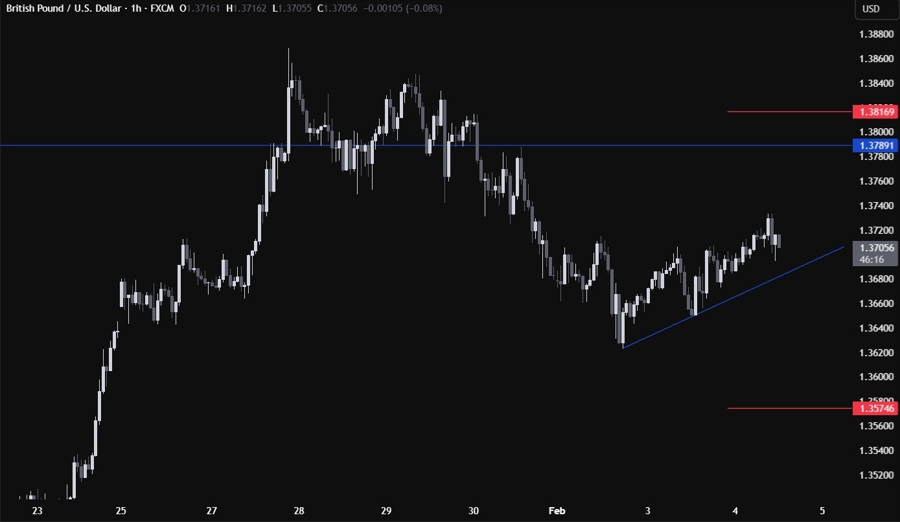
On the 1 hour chart, there’s not much we can add here as the buyers will look for a bounce around the trendline, while the sellers will look for a break lower. The red lines define the average daily range for today.
UPCOMING CATALYSTS
Today we get the US ADP and the US ISM Services PMI. Tomorrow, we have the BoE rate decision and the US Jobless Claims figures. On Friday, we conclude the week with the University of Michigan Consumer Sentiment data.


