
FUNDAMENTAL OVERVIEW
USD:
The US Dollar remains on the backfoot as the bearish momentum set by the USD/JPY intervention risks kept weighing on the greenback. US Treasury Secretary Bessent yesterday said that they are not intervening in dollar-yen now and that gave the dollar a bit of a boost although it didn’t last long.
The Fed kept interest rates unchanged as expected and upgraded a bit its current economic outlook in the statement to reflect the recent economic data. There was no surprise other than Fed’s Waller voting for a cut. That might have been just his last attempt to secure the nomination for the Fed chair job. Time will tell.
Fed Chair Powell didn’t offer much in terms of forward guidance and just stuck to the script by reiterating the neutral stance and data-dependency. Today, we get the latest US Jobless Claims figures which could give the dollar some support if they come out strong. Otherwise, the greenback might remain on the backfoot until further notice.
GBP:
On the GBP side, the latest UK Flash PMIs came out much stronger than expected and triggered a slightly hawkish repricing which gave the pound a boost. The employment and inflation reports, on the other hand, came out basically in line with expectations.
As a reminder, the BoE cut by 25 bps at the last meeting and sounded more optimistic on the inflation outlook after a very soft inflation report in November. The market is pricing 34 bps of easing by year-end with the next cut seen in June at the earliest.
GBPUSD TECHNICAL ANALYSIS – DAILY TIMEFRAME
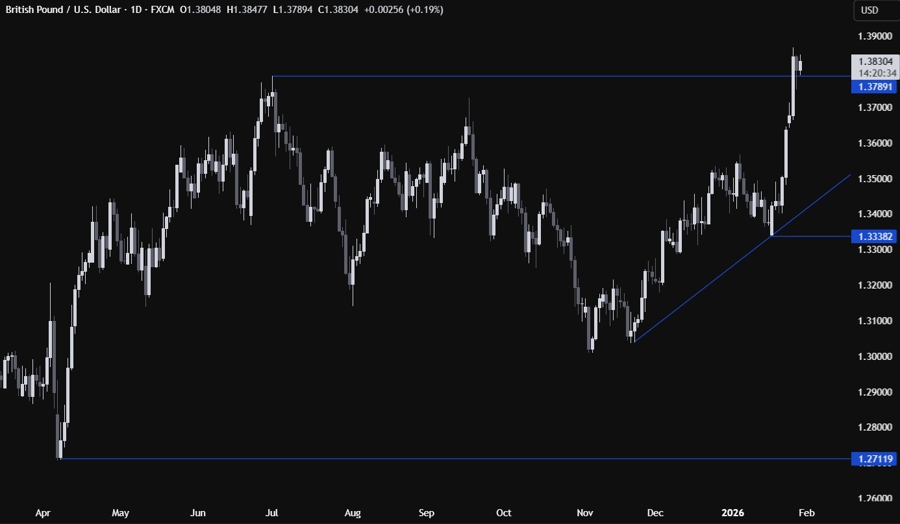
On the daily chart, we can see that GBPUSD rose into a new cycle high this week as the US Dollar continued to weaken across the board. This is where we can expect the buyers to step in with a defined risk below the recent lows to keep pushing into new highs. The sellers, on the other hand, will want to see the price falling back below the previous cycle high at 1.3789 to position for a correction into the major trendline around the 1.35 handle.
GBPUSD TECHNICAL ANALYSIS – 4 HOUR TIMEFRAME
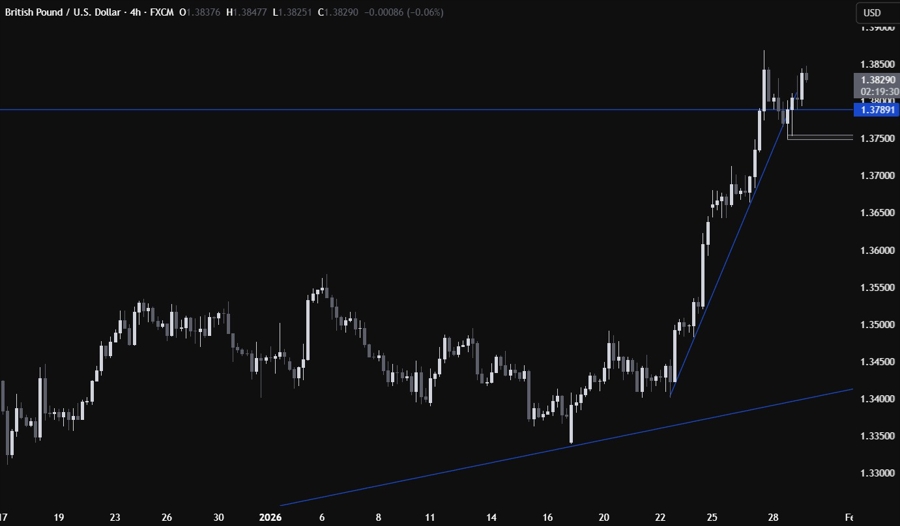
On the 4 hour chart, we can see that we had a steep minor upward trendline defining the bullish momentum. The price broke below the trendline which generally precedes a pullback or some consolidation. The most recent swing low around the 1.3750 level should act as support. If the price gets there, we can expect the buyers to step in with a defined risk below the swing level to position for a rally into new highs. The sellers, on the other hand, will look for a break lower to pile in for a drop into the major trendline around the 1.35 handle.
GBPUSD TECHNICAL ANALYSIS – 1 HOUR TIMEFRAME
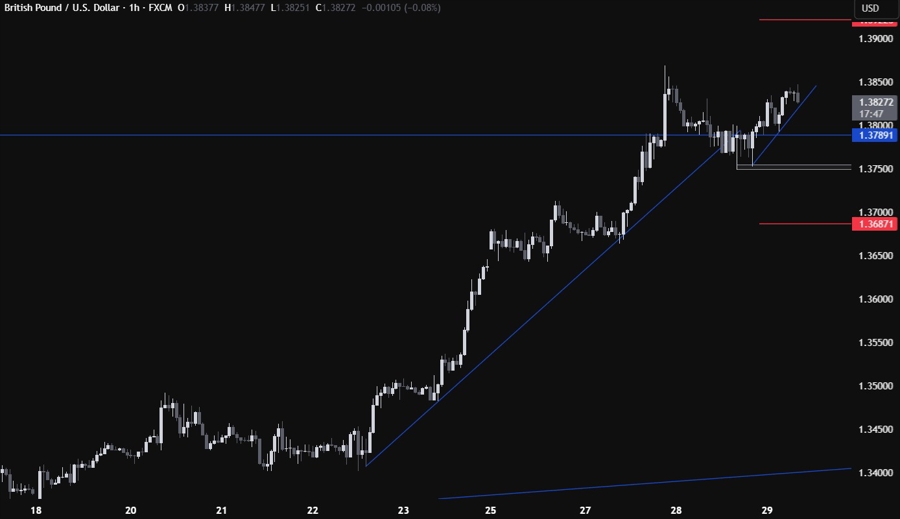
On the 1 hour chart, we can see that we have a minor counter-trendline that act as support. The buyers will likely continue to lean on the minor trendline to keep pushing into new highs, while the sellers will look for a break lower to position for a pullback into the 1.3750 level targeting a break below it. The red lines define the average daily range for today.
UPCOMING CATALYSTS
Todaywe get the latest US Jobless Claims figures. Tomorrow, we conclude the week with the US PPI report.
