
Fundamental Overview
The USD finished last week at the lows despite the lack of meaningful catalysts. Overall, it just maintained the bearish bias triggered by Powell’s dovish tilt at the Jackson Hole Symposium. This week it’s doing the opposite with most of last week’s losses already erased. We are just ranging ahead of the key US data.
In fact, traders will be focused on the US labour market data this week, culminating in the NFP report on Friday. The data will influence interest rates expectations greatly. Right now, the market is pricing an 89% probability of a rate cut in September and a total of 55 bps of easing by year-end.
Strong data might take the probability for a September cut towards a 50/50 chance but will certainly see a more hawkish repricing further down the curve and likely support the dollar. Soft data, on the other hand, will likely see traders increasing the dovish bets with a third cut by year-end being priced in and weighing on the greenback.
On the GBP side, the BoE delivered a hawkish cut at the last meeting and since then the data has been coming on the hotter side. In fact, the latest UK CPI surprised once again to the upside and the latest Flash PMIs, although mixed, showed strength and persistent inflationary pressures.
Inflation should be the central bank’s biggest concern even if it takes labour market weakness to get back to 2%. That’s even more important now that UK long term yields continue to surge. The bond market got tired of the lack of actions to fix the inflation problem.
GBPUSD Technical Analysis – Daily Timeframe
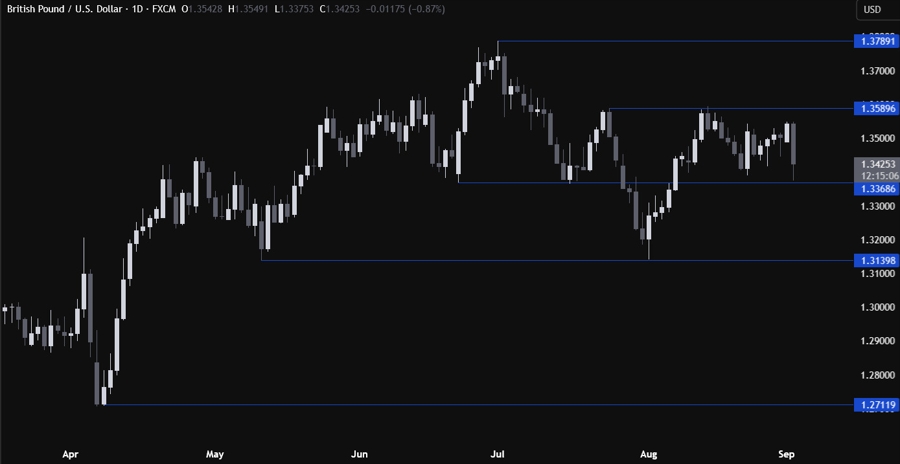
On the daily chart, we can see that GBPUSD sold off all the way back to the key 1.3368 support today after the UK 30yr yields jumped to a new cycle high. The price is now bouncing as the buyers stepped in with a defined risk below the support to position for a rally back into the 1.3590 resistance. The sellers, on the other hand, will look for a break lower to increase the bearish bets into the 1.3140 level next.
GBPUSD Technical Analysis – 4 hour Timeframe
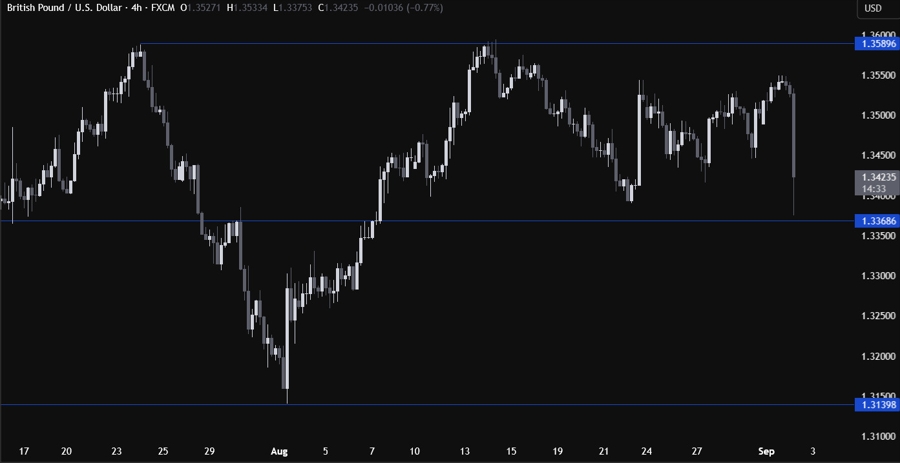
On the 4 hour chart, we can see more clearly the bounce from the support. There’s not much else we can glean from this timeframe, so we need to zoom in to see some more details.
GBPUSD Technical Analysis – 1 hour Timeframe
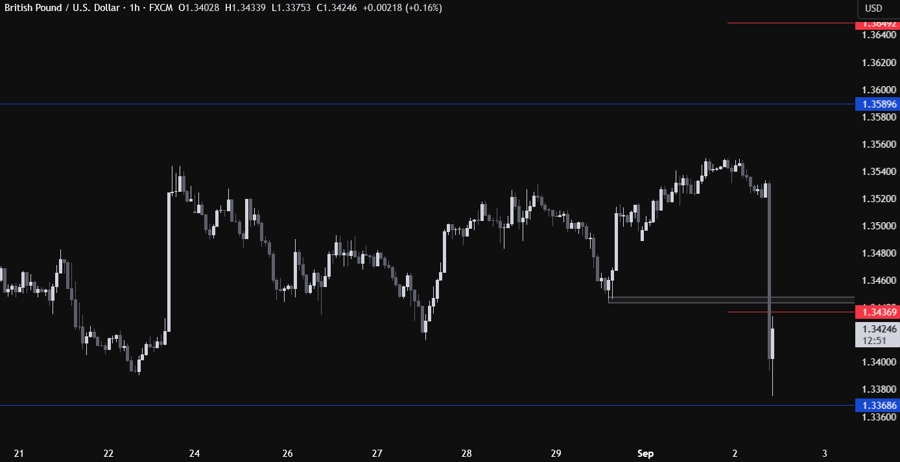
On the 1 hour chart, we can see that the most recent swing low around the 1.3445 level could act as a minor resistance. If the price gets there, we can expect the sellers to step in with a defined risk above the resistance to keep pushing into new lows. The buyers, on the other hand, will look for a break higher to increase the bullish bets into the resistance. The red lines define the average daily range for today.
Upcoming Catalysts
Today we get the US ISM Manufacturing PMI. Tomorrow, we have the US Job Openings data. On Thursday, we get the US ADP, the latest US Jobless Claims figures and the US ISM Services PMI. On Friday, we conclude the week with the US NFP report.


