
Fundamental Overview
The USD came under pressure on Friday following the softer than expected US CPI report. The market pricing didn’t change much as it was already very dovish going into the report, but given the positive risk sentiment, the greenback remained on the backfoot.
Over the weekend, we got some very positive comments from US Treasury Secretary Bessent as US-China held trade talks in Malaysia. It looks like they’ve reached a deal, and we are now just waiting for the Trump-Xi meeting on Thursday where the two leaders are expected to confirm the positive developments.
The risk-on sentiment is expected to weigh on the dollar in the short-term, although Treasury yields could also erase the drop triggered by Trump’s escalation a couple of weeks ago. This could create some tension between bullish and bearish drivers, but for now there’s no strong reason for the dollar to rally amid the lack of key US data.
The Fed is widely expected to cut by 25 bps on Wednesday and keep the status quo given the lack of US data. For this reason, the decision is likely to be a non-event.
On the GBP side, we got some dovish repricing in interest rate expectations following the soft UK CPI last week. The data didn’t change much for the upcoming November meeting where the BoE is expected to keep rates steady, but the market is now seeing the December meeting as live for a cut.
The market pricing now shows 17 bps of easing by year-end (was 11 before UK CPI) and 63 bps cumulatively by the end of 2026 (was 50 bps prior).
GBPUSD Technical Analysis – Daily Timeframe
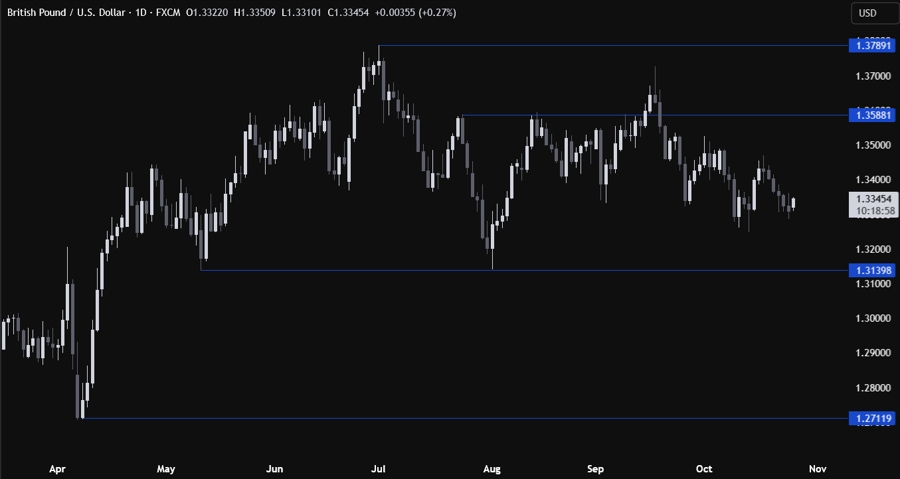
On the daily chart, we can see that GBPUSD is trading right in the middle of the two key levels at 1.3588 and 1.3140. There’s not much we can glean from this timeframe, so we need to zoom in to see some more details.
GBPUSD Technical Analysis – 4 hour Timeframe
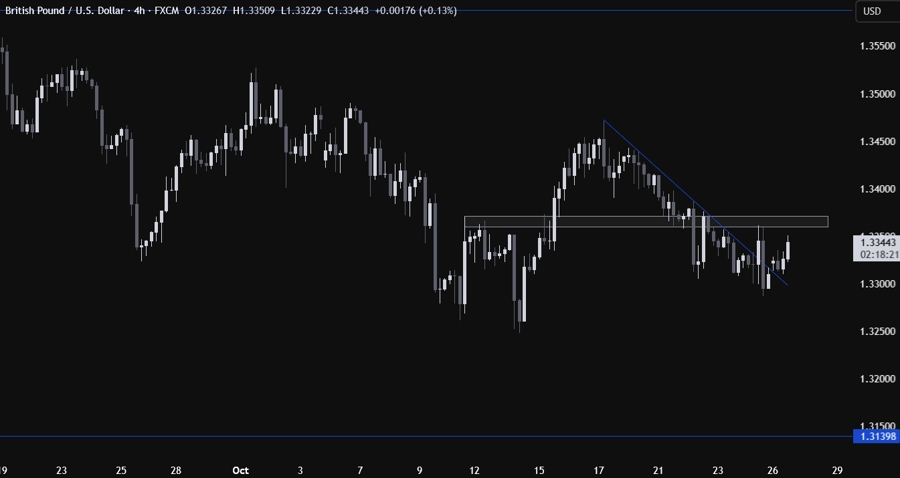
On the 4 hour chart, we can see that the price broke the downward trendline to the upside and it’s now trading near the 1.3360 resistance zone. This is where we can expect the sellers to step in with a defined risk above the resistance to position for a drop into the 1.3140 level. The buyers, on the other hand, will want to see the price breaking higher to increase the bullish bets into the 1.3588 level next.
GBPUSD Technical Analysis – 1 hour Timeframe
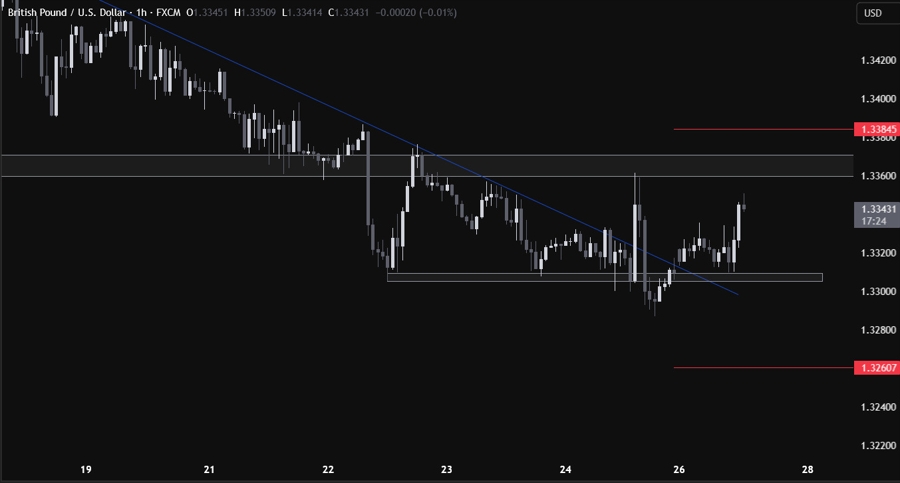
On the 1 hour chart, there’s not much else we can add here as we are just basically ranging between the 1.3360 resistance and the 1.3308 support. The market participants will likely keep on playing the range until we get a breakout on either side. The red lines define the average daily range for today.
Upcoming Catalysts
On Wednesday we have the FOMC policy decision, while on Thursday, we have the Trump-Xi meeting.
