
Fundamental Overview
The USD has been weak almost across the board since the NFP report as the softer than expected data triggered a quick dovish repricing and a change in stance for many Fed members.
The market is pricing 58 bps of easing by year-end compared to just 35 bps before the NFP release. It’s highly likely that more benign data will see Fed Chair Powell opening the door for a cut in September at the Jackson Hole Symposium.
The focus now turned to the US CPI report due tomorrow. The recent Fedspeak suggests that a rate cut in September might be unavoidable, so we might need very hot inflation data to change their mind (and of course a good NFP report in September).
On the GBP side, the BoE delivered a hawkish cut last week with the first voting round failing to produce a majority. It was the first time ever the BoE had to conduct two voting rounds to reach a majority. Moreover, inflation forecasts were revised upwards, and the statement leant on the more hawkish side with these two lines: “upside risks around medium-term inflationary pressures have moved slightly higher” and “the restrictiveness of monetary policy has fallen.”
The central bank is finally acknowledging that inflation should be their biggest concern given that the UK still has one of the highest inflation rates among the major countries. In fact, core inflation has never fallen below 3% since 2021. Couple that with high wage growth and a central bank that is cutting rates and the outlook gets very tricky for the BoE.
GBPUSD Technical Analysis – Daily Timeframe
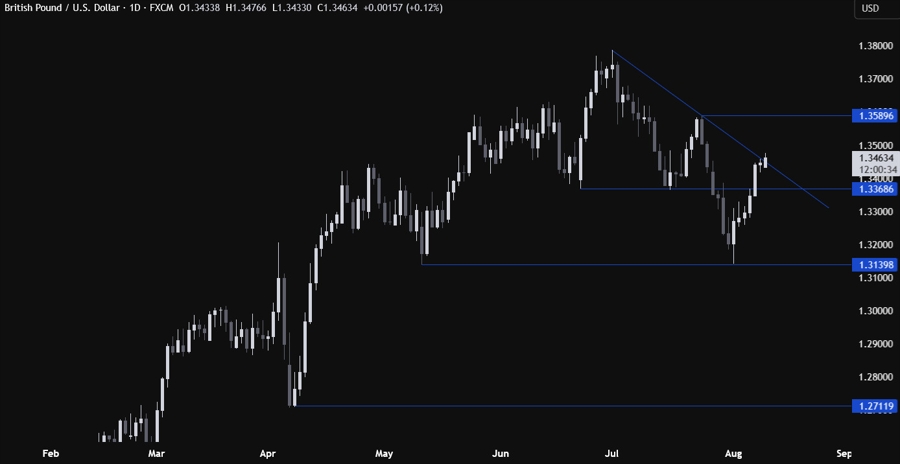
On the daily chart, we can see that GBPUSD is now trading around the major downward trendline. This is where we can expect the sellers to step in with a defined risk above the trendline to position for a drop back into the 1.3140 level. The buyers, on the other hand, will likely pile in around these levels to extend the rally into the 1.3590 level next.
GBPUSD Technical Analysis – 4 hour Timeframe
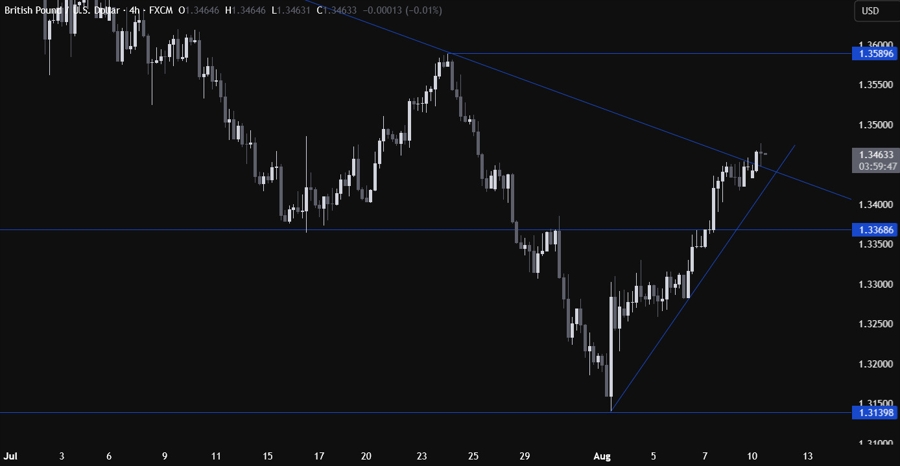
On the 4 hour chart, we can see that we have a minor upward trendline defining the bullish momentum on this timeframe. If we get a pullback, the buyers will likely lean on the trendline with a defined risk below it to keep pushing into new highs. The sellers, on the other hand, will look for a break lower to increase the bearish bets into the 1.3140 level next.
GBPUSD Technical Analysis – 1 hour Timeframe
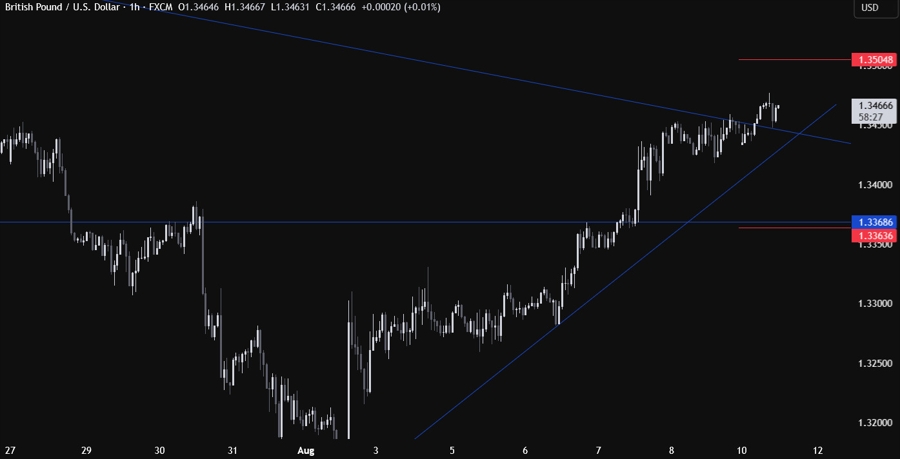
On the 1 hour chart, there’s not much we can add here as the buyers will look for a bounce around the upward trendline, while the sellers will target a break. The red lines define the average daily range for today.
Upcoming Catalysts
Tomorrow we have the UK Employment report and the US CPI. On Thursday, we get the UK GDP, the US PPI and the US Jobless Claims figures. On Friday, we conclude the week with the US Retail Sales and the University of Michigan Consumer Sentiment report. Focus also on Fedspeak, especially after the US CPI data.


