Fundamental Overview
The USD yesterday got a boost across the board following the US CPI report. The data was actually in line with expectations and arguably on the softer side than feared. In fact, the market didn’t really move much following the release but roughly an hour later we started to see strong bids in the greenback.
This might have to do with positioning since the “short US dollar” trade has been the most crowded one and in such instances, it doesn’t take much to see strong unwinding. The market did pare back further the rate cut bets with the pricing now showing 44 bps of easing by year end compared to 47 bps before the CPI release. That could still change today after the US PPI report.
On the GBP side, the UK CPI today came out much higher than expected across the board. Even though we got these hotter figures, traderreduced BoE easing bets just slightly to 50 bps by year-end compared to 53 bps before the CPI release. In the bigger picture, the base case was two rate cuts by year-end anyway, so even if they skip August, they will still have three meetings to cut. Tomorrow, there’s still the UK employment report which could influence the pricing.
GBPUSD Technical Analysis – Daily Timeframe
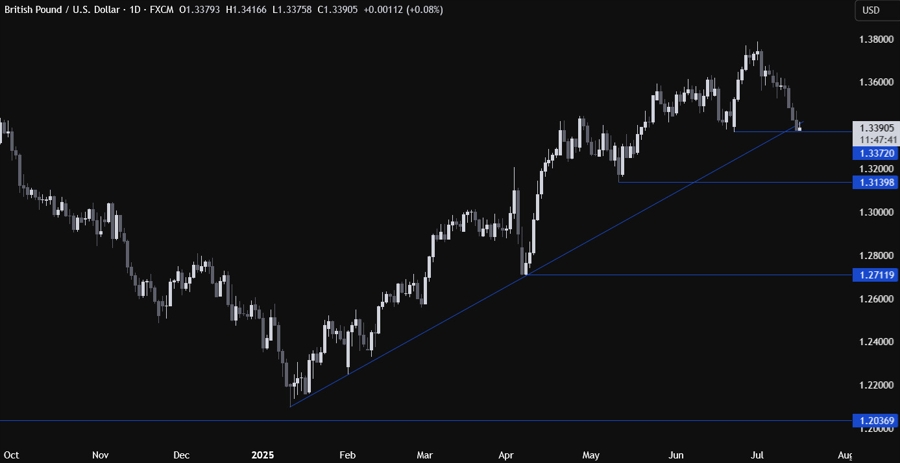
On the daily chart, we can see that GBPUSD eventually erased all the gains from the dovish Fed’s Bowman comments back in late June and pulled all the way back into the key support around the 1.3370 level where we have also the major trendline for confluence.
This is where we can expect the buyers to step in with a defined risk below the support to position for a rally into a new cycle high. The sellers, on the other hand, will look for a break lower to increase the bearish bets into the 1.3140 level next.
GBPUSD Technical Analysis – 4 hour Timeframe
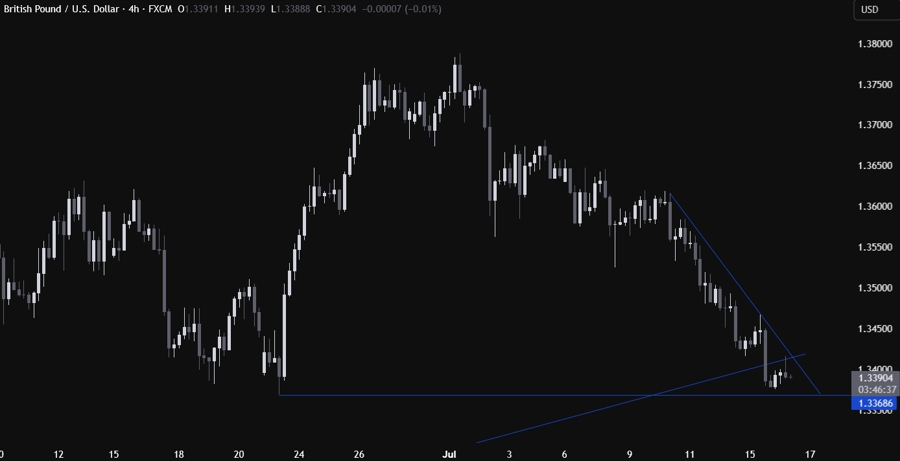
On the 4 hour chart, we can see more clearly the support zone around the 1.3370 level. We have now also a minor downward trendline defining the bearish momentum. The sellers will likely continue to lean on it to keep pushing into new lows, while the buyers will look for a break higher to increase the bullish bets into 1.38 handle next.
GBPUSD Technical Analysis – 1 hour Timeframe
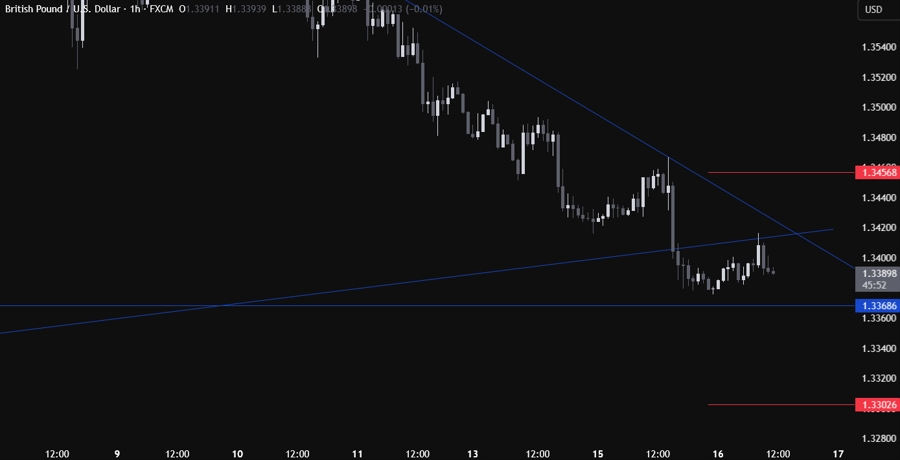
On the 1 hour chart, there’s not much else we can add here as the sellers will look for a rejection from the trendline or a break below the support, while the buyers will keep on stepping in around the support and wait for a break above the trendline. The red lines define the average daily range for today.
Upcoming Catalysts
Today we have the US PPI data. Tomorrow, we get the UK employment report and the latest US Jobless Claims and Retail Sales figures. On Friday, we conclude the week with the University of Michigan Consumer Sentiment survey.


