
Fundamental Overview
The USD has been weakening across the board ever since Fed’s Williams endorsed a December rate cut. The greenback then extended the losses further last week following soft ADP data and a Bloomberg report saying that Hassett emerged as the frontrunner for the Fed Chair position.
The probability for a December cut is now at 87%, which makes it a done deal. We won’t get much data before the FOMC meeting, so the focus will likely be mainly on jobless claims and ADP data, which haven’t been showing any strong improvement.
Weak data should keep weighing on the greenback, while strong data could provide some short-term reprieve. At the end of the day though, it’s all about the FOMC decision now and the following NFP and CPI reports.
On the GBP side, the market sees a 90% probability of a rate cut this month and a total of 62 bps of easing by the end of 2026 following soft UK data. The Autumn Budget announcement was well received with the pound strengthening across the board, even though eventually it gave back the gains.
GBPUSD Technical Analysis – Daily Timeframe
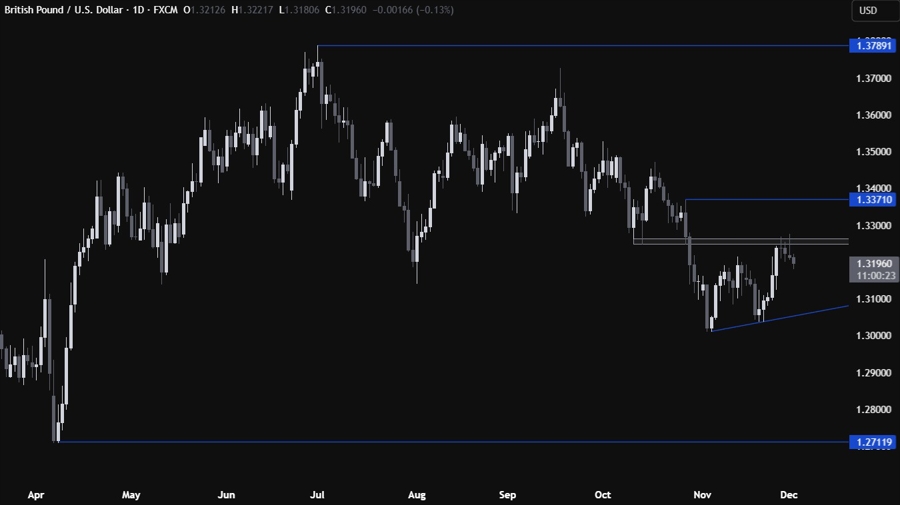
On the daily chart, we can see that GBPUSD couldn’t break above the resistance around the 1.3250 level and pulled back a bit. If the price gets there again, we can expect the sellers to step in with a defined risk above the resistance to position for a drop into the trendline. The buyers, on the other hand, will want to see the price breaking higher to increase the bullish bets into the 1.3370 level next.
GBPUSD Technical Analysis – 4 hour Timeframe
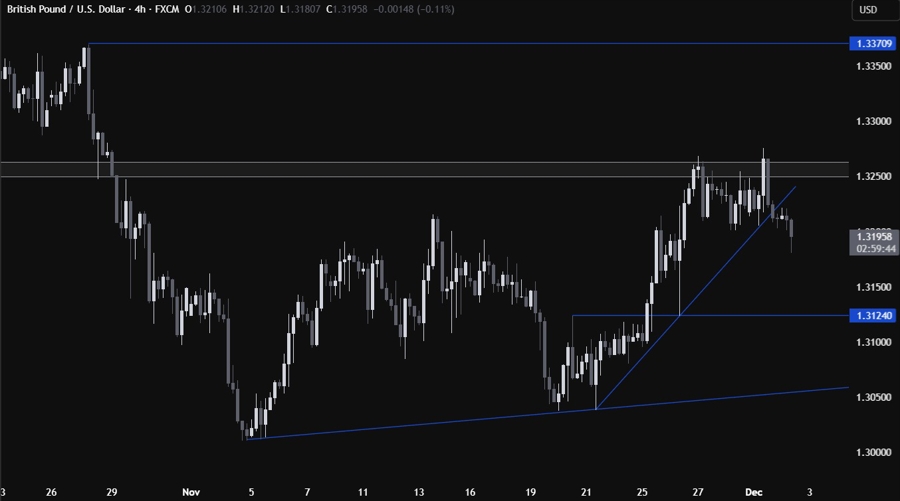
On the 4 hour chart, we can see that the price broke below the upward trendline, opening the door for a bigger pullback into the 1.3125 level. If the price gets there, we can expect the buyers to step in with a defined risk below the level to position for a rally into the 1.3250 resistance. The sellers, on the other hand, will look for a break lower to increase the bearish bets into the trendline around the 1.3070 level.
GBPUSD Technical Analysis – 1 hour Timeframe
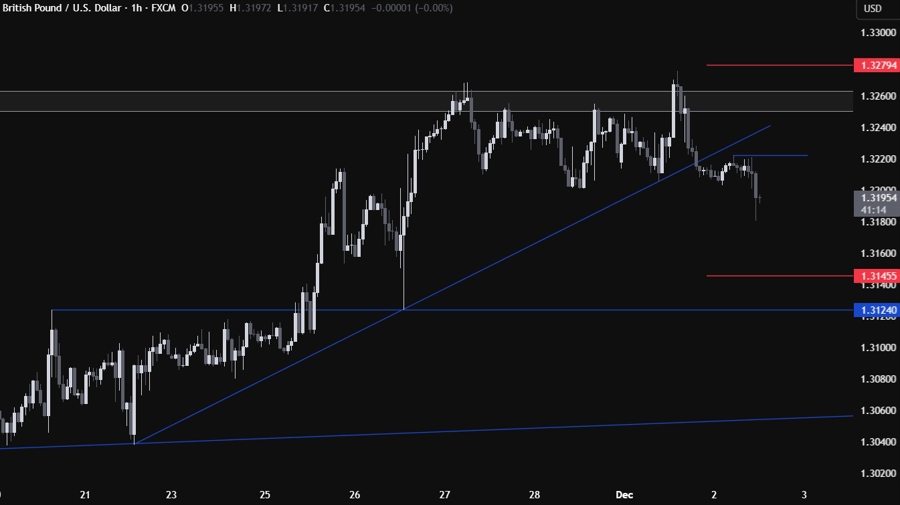
On the 1 hour chart, there’s not much else we can add here but given the more bearish short-term bias, the sellers might wait for the price to come into the recent swing high at 1.3220 to position for a drop into the 1.3125 level with a better risk to reward setup. The buyers, on the other hand, will look for a break higher to target a break above the 1.3250 resistance. The red lines define the average daily range for today.
Upcoming Catalysts
Tomorrow we have the US ADP and the US ISM Services PMI. On Thursday, we get the latest US Jobless Claims figures. On Friday, we conclude the week with the University of Michigan Consumer Sentiment report.
