
Fundamental Overview
The USD came under some renewed pressure following the US CPI report. The data was mostly in line with forecasts and not strong enough to deter the market from expecting a cut in September.
In fact, the pricing actually increased to 60 bps of easing by year-end compared to 57 bps before the CPI release. This just shows that the market is now very confident on a September cut and fully prices in at least another one before the end of the year.
A September cut looks unavoidable now and only a hot NFP report in September might get us to a 50% probability, although it would certainly diminish expectations for rate cuts after the September one. For August, we have now just Fed Chair Powell’s speech at the Jackson Hole Symposium as the next major event. Traders will be eager to see if he changes his stance as well.
On the GBP side, the BoE delivered a hawkish cut last week with the first voting round failing to produce a majority. It was the first time ever the BoE had to conduct two voting rounds to reach a majority. Moreover, inflation forecasts were revised upwards, and the statement leant on the more hawkish side with these two lines: “upside risks around medium-term inflationary pressures have moved slightly higher” and “the restrictiveness of monetary policy has fallen.”
The central bank is finally acknowledging that inflation should be their biggest concern given that the UK still has one of the highest inflation rates among the major countries. In fact, core inflation has never fallen below 3% since 2021. Couple that with high wage growth and a central bank that is cutting rates, and the outlook gets very tricky for the BoE.
GBPUSD Technical Analysis – Daily Timeframe
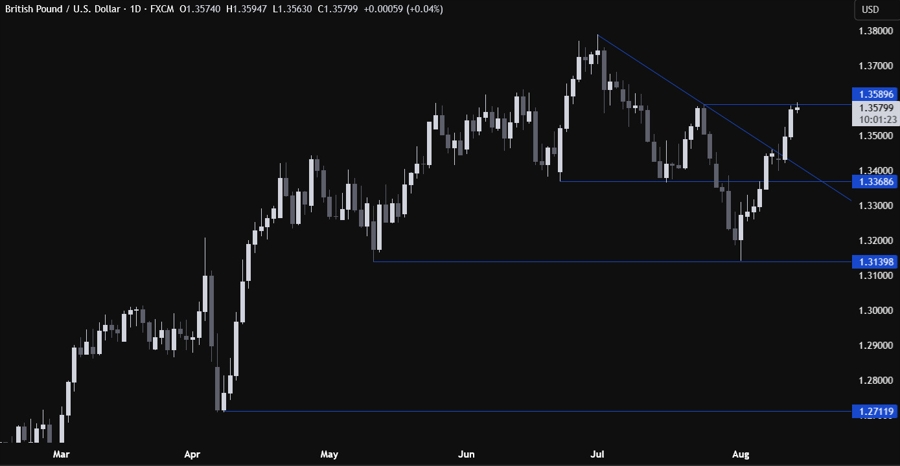
On the daily chart, we can see that GBPUSD has rallied all the way up to the key swing level at 1.3590. This is where we can expect the sellers to step in with a defined risk above the level to position for a drop back into the 1.3368 level. The buyers, on the other hand, will want to see the price breaking higher to increase the bullish bets into the 1.38 handle next.
GBPUSD Technical Analysis – 4 hour Timeframe
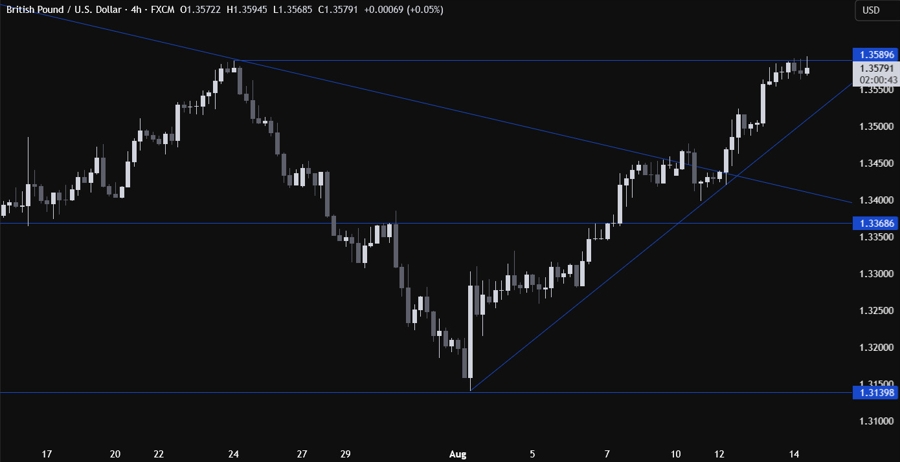
On the 4 hour chart, we can see that we have a minor upward trendline defining the bullish momentum on this timeframe. If we get a pullback, the buyers will likely lean on the trendline with a defined risk below it to keep pushing into new highs. The sellers, on the other hand, will look for a break lower to increase the bearish bets into the 1.3368 level next.
GBPUSD Technical Analysis – 1 hour Timeframe
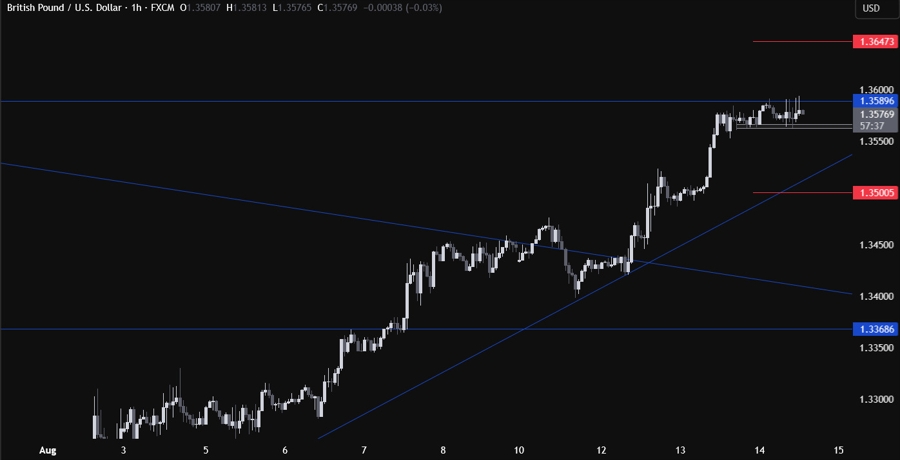
On the 1 hour chart, there’s not much we can add here although on an intraday basis, we have a very tight range, so a break on either side might trigger a more sustained move. The red lines define the average daily range for today.
Upcoming Catalysts
Today we get the US PPI and the US Jobless Claims figures. Tomorrow, we conclude the week with the US Retail Sales and the University of Michigan Consumer Sentiment report.


