
Fundamental Overview
The USD started the week on a positive note as the risk of a hawkish Powell has been keeping the markets on edge. We’ve also seen some downside in equities without any fundamental catalyst, which might indicate some profit-taking and hedging into the Jackson Hole event.
The recent data shouldn’t give Powell any conviction to pre-commit to a rate cut in September as the Jobless Claims data continued to improve and the inflation readings have increased further, so the NFP report in September is going to be crucial. The market trimmed its aggressive rate cut bets and we are now back at pricing around 52 bps of easing by year-end.
On the GBP side, the BoE delivered a hawkish cut at the last meeting and since then the data has been coming on the hotter side. In fact, the latest UK CPI surprised once again to the upside and today’s Flash PMIs, although mixed, showed strength and persistent inflationary pressures.
Inflation should be the central bank’s biggest concern even if it takes labour market weakness to get back to 2%. Core inflation has never fallen below 3% since 2021. That’s a long time and might have influenced negatively inflation expectations making a return to 2% even harder.
GBPUSD Technical Analysis – Daily Timeframe
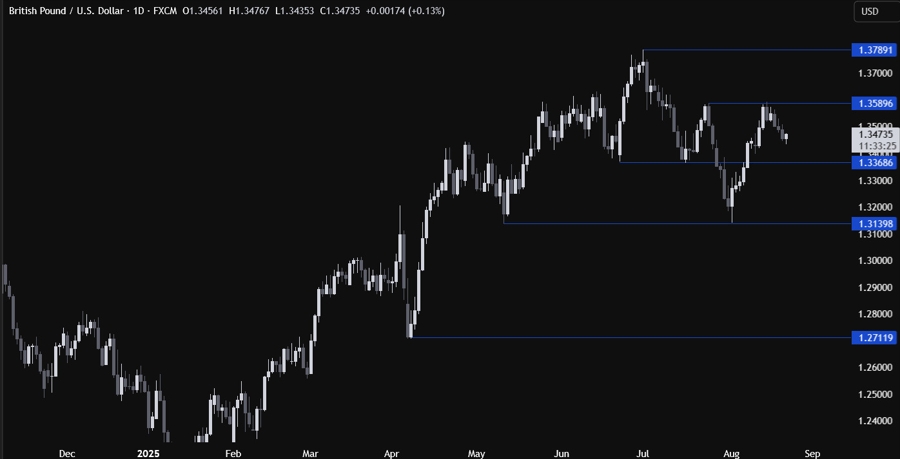
On the daily chart, we can see that GBPUSD continues to edge lower after the rejection at the key 1.3590 swing level. The sellers will likely continue to target the 1.3368 level and if we get there, we can expect the buyers to step in with a defined risk below the level to position for a rally back into the 1.3590 level next.
GBPUSD Technical Analysis – 4 hour Timeframe
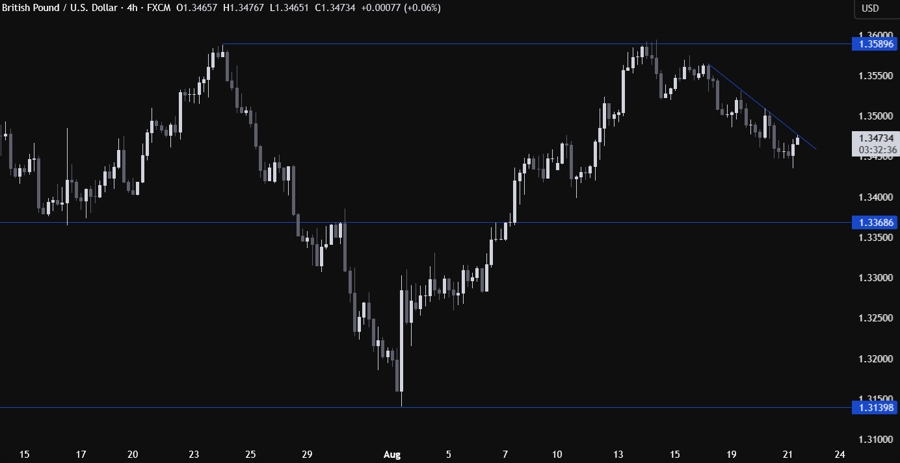
On the 4 hour chart, we can see that we have a minor downward trendline defining the bearish momentum on this timeframe. The sellers will likely continue to lean on the trendline to keep pushing into new lows, while the buyers will look for a break higher to pile in for a rally back into the 1.3590 level.
GBPUSD Technical Analysis – 1 hour Timeframe
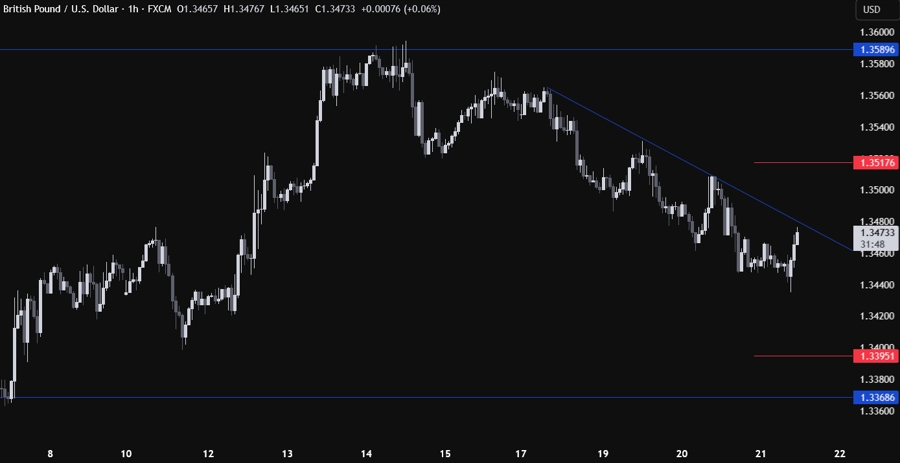
On the 1 hour chart, there’s not much we can add here as the sellers will look for a rejection and new lows, while the buyers will look for a break and a rally into new highs. The red lines define the average daily range for today.
Upcoming Catalysts
Today we get the latest US Jobless Claims figures and the US Flash PMIs. Tomorrow, we conclude the week with Fed Chair Powell speech at the Jackson Hole Symposium.
