
Fundamental Overview
The USD has weakened pretty much across the board last week despite a strong US ADP and ISM Services PMI. As mentioned previously, when markets react like that it’s generally a signal of a short-term top with the market needing more to keep the trend going.
In fact, the market pricing is now showing a 63% probability of a December cut, which is about right. The NFP and CPI reports will have the final say, and hopefully we will get them before the next FOMC decision.
On the GBP side, the BoE held the Bank Rate steady with a 5-4 vote split as BoE’s Breeden joined the doves and voted to cut rates by 25 bps. The first reaction was dovish as pretty much everything suggested that a rate cut in December was almost a sure thing.
In the press conference though, BoE Governor Bailey sounded like a December cut was conditional on a confirmation of the improvement in inflation. The BoE will get two employment and inflation reports before the next meeting, so they will have enough data to make a better decision. The market is currently pricing a 57% chance of a rate cut in December.
GBPUSD Technical Analysis – Daily Timeframe
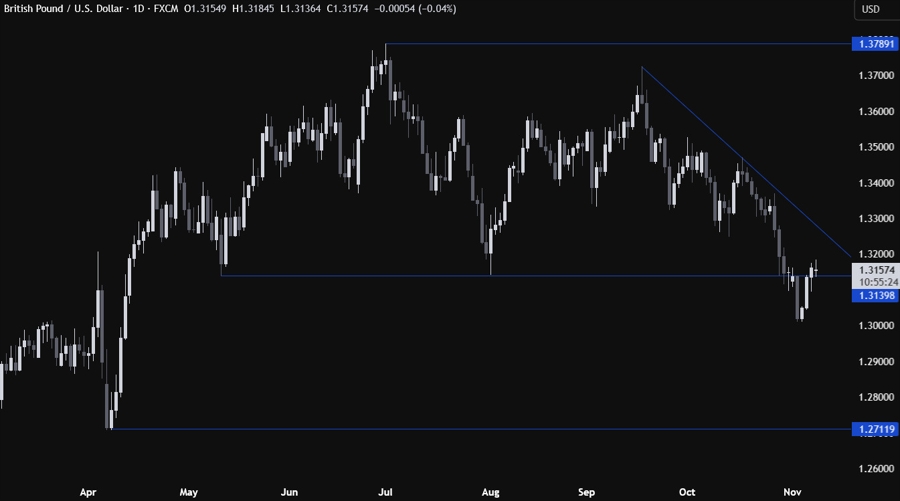
On the daily chart, we can see that GBPUSD pulled all the way back to the key 1.3140 level, with the price eventually breaking above it. This is where the buyers are expected to increase the bullish bets into the major trendline around the 1.3250 level. The sellers, on the other hand, will want to see the price falling back below the 1.3140 level to pile in for a drop into new lows or alternatively, wait for the price to come into the trendline to short with a better risk to reward setup.
GBPUSD Technical Analysis – 4 hour Timeframe
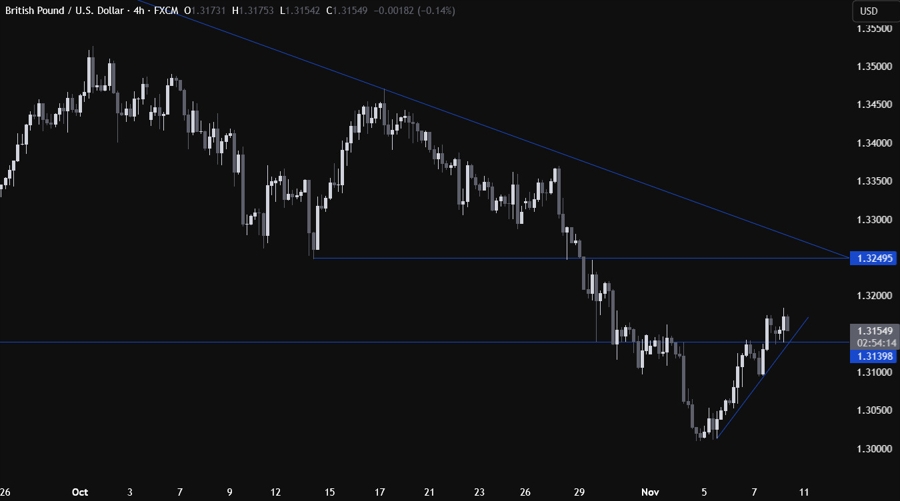
On the 4 hour chart, we can see that we have a minor upward trendline defining the current pullback. The buyers will likely continue to lean on the trendline to keep pushing into new highs, while the sellers will look for a break lower to start targeting new lows.
GBPUSD Technical Analysis – 1 hour Timeframe
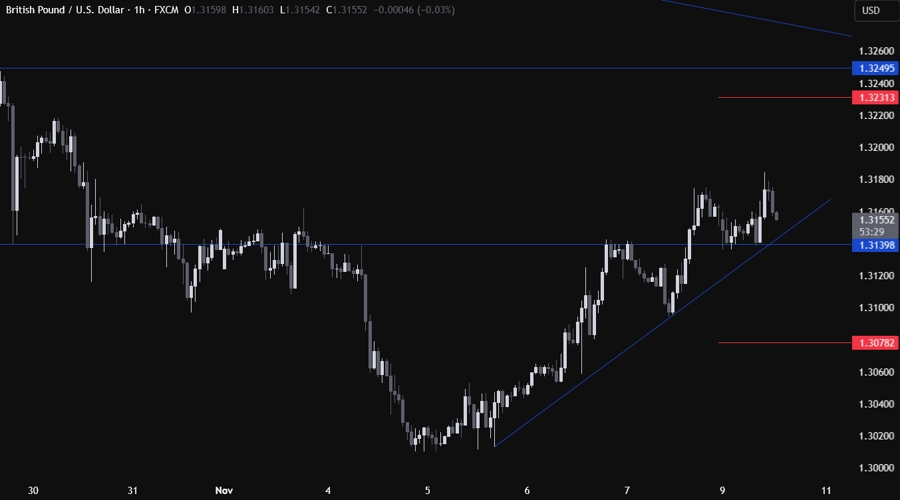
On the 1 hour chart, there’s not much else we can add here as the buyers will look for longs around the trendline and the 1.3140 level, while the sellers will want to see the price breaking lower to pile in for new lows. The red lines define the average daily range for today.
Upcoming Catalysts
This week is pretty empty on the data front. Tomorrow, we have the UK employment report and the weekly US ADP data, while on Thursday we get the UK GDP report.
