
Fundamental Overview
The USD sold off across the board on Friday following a softer than expected NFP report. Overall, the data wasn’t as bad as one might think by just looking at the reaction but given that we were positioned for a strong report and the pricing got more hawkish after the Fed’s decision, the weaker data was enough to trigger a quick repricing.
In fact, the market at some point was pricing 60 bps of easing by year-end compared to just 35 bps before the NFP release. That’s a pretty quick change of heart. Over the weekend, we also got Fed’s Williams opening the door for a cut in September and Fed’s Daly on Monday echoed the same sentiment. The NFP clearly made them a bit more worried, and a September cut seems now a done deal.
It’s highly likely that more benign data will see Fed Chair Powell opening the door for a cut in September at the Jackson Hole Symposium. Nonetheless, the ISM Services PMI yesterday showed a new high in the prices index which could keep traders on edge heading into the US CPI next week. Tomorrow, we get the US Jobless Claims and good data might trigger a rethink on the actual softness of the labour market.
On the GBP side, the BoE tomorrow is expected to cut interest rates by 25 bps which would be in line with the central bank’s strategy of cutting at a quarterly pace. The UK data has been mixed with inflation surprising to the upside, while the employment report disappointing. The BoE is likely to reaffirm its gradual and careful approach and remain data-dependent. The market is expecting another rate cut by the end of the year.
GBPUSD Technical Analysis – Daily Timeframe
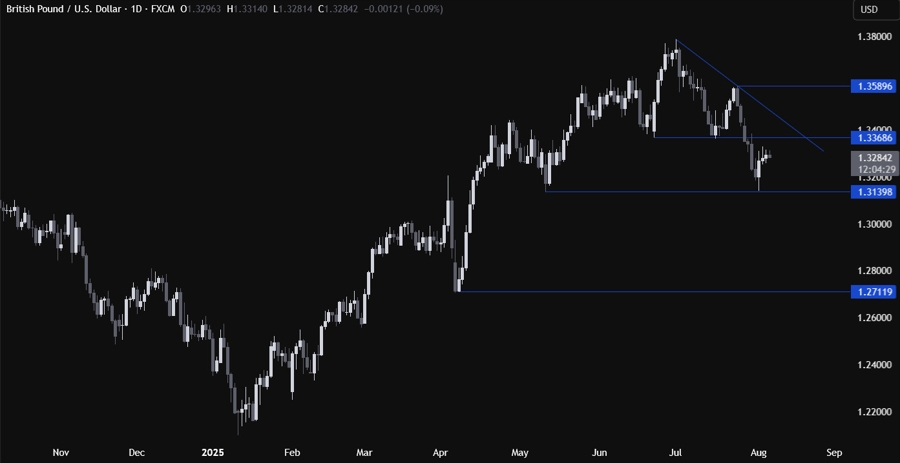
On the daily chart, we can see that GBPUSD bounced from a key swing level at 1.3140. The price is now close to the key resistance around the 1.3368 level. That’s where we can expect the sellers to step in with a defined risk above the resistance to position for a drop back into the 1.3140 level. The buyers, on the other hand, will look for a break higher to increase the bullish bets into new highs.
GBPUSD Technical Analysis – 4 hour Timeframe
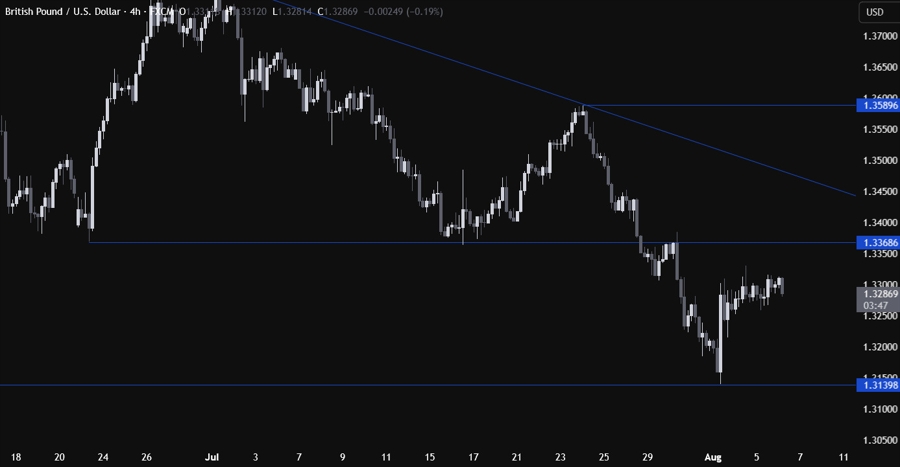
On the 4 hour chart, there’s not much we can glean from this timeframe as the price is just consolidating, and we don’t have any key level where to lean onto. We need to zoom in to see some more details.
GBPUSD Technical Analysis – 1 hour Timeframe
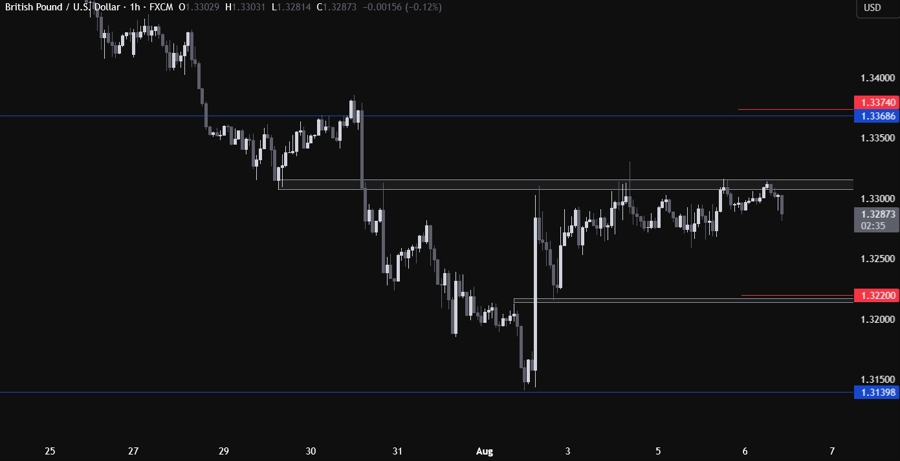
On the 1 hour chart, we can see that we have a minor resistance zone around the 1.3310 level where the price got rejected from several times in the past days. The sellers will likely continue to lean on the resistance to keep pushing into new lows, while the buyers will look for a break higher to extend the rally into the 1.3368 resistance next. The red lines define the average daily range for today.
Upcoming Catalysts
Tomorrow we have the BoE rate decision and the US Jobless Claims.
