
Fundamental Overview
The USD strengthened a bit on Friday following some positive Trump’s comments on China as Treasury yields bounced and erased the Thursday’s losses. Overall, the US dollar performance has been mixed as markets have been driven by quick changes in risk sentiment since Trump’s tariffs threat.
On the domestic side, the US government shutdown continues to delay many key US economic reports. The dollar “repricing trade” needs strong US data to keep going, especially on the labour market side, so any hiccup on that front is weighing on the greenback.
The BLS will release the US CPI report on Friday despite the shutdown, so that’s going to be a key risk event. That will need to be seen in the context of US-China relations and any negative shock by that time though. If things go south, then the CPI will not matter much as growth fears will trump everything else.
On the GBP side, we haven’t got any meaningful change in the fundamentals. The BoE left interest rates unchanged at the last meeting but slowed the pace of QT. The forward guidance was mostly the same with the focus being more on the inflation side now. The UK continues to have a serious inflation problem with high core CPI, high wages and rising consumer inflation expectations.
We saw some dovish repricing following the soft UK employment report with the market now seeing 11 bps of easing by year-end and 50 bps by the end of 2026. This week we have the UK CPI report which is going to be more important for the BoE.
GBPUSD Technical Analysis – Daily Timeframe
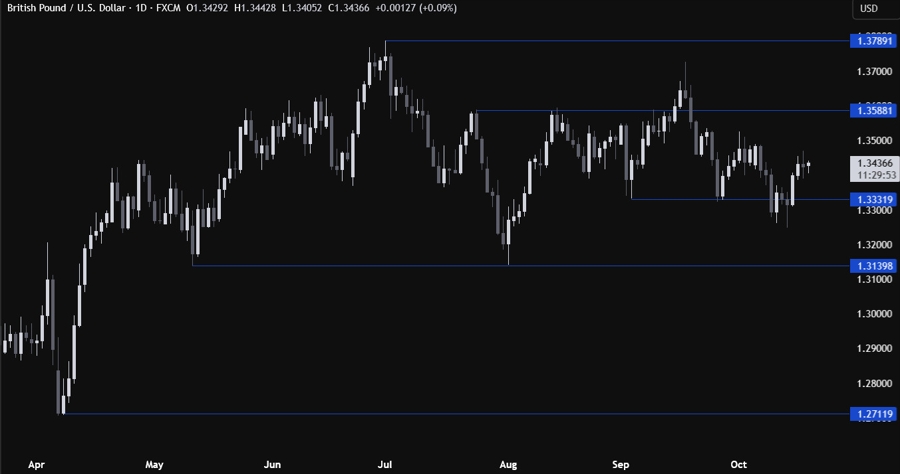
On the daily chart, we can see that GBPUSD probed below the key 1.3332 level a couple of times in the past two weeks but eventually the breakout got invalidated and the price bounced back strongly. If the price rises all the way back to the 1.3588 level, we can expect the sellers to step in there with a defined risk above the resistance to position for a drop back into the 1.3332 level. The buyers, on the other hand, will want to see the price breaking higher to increase the bullish bets into the 1.3789 level next.
GBPUSD Technical Analysis – 4 hour Timeframe
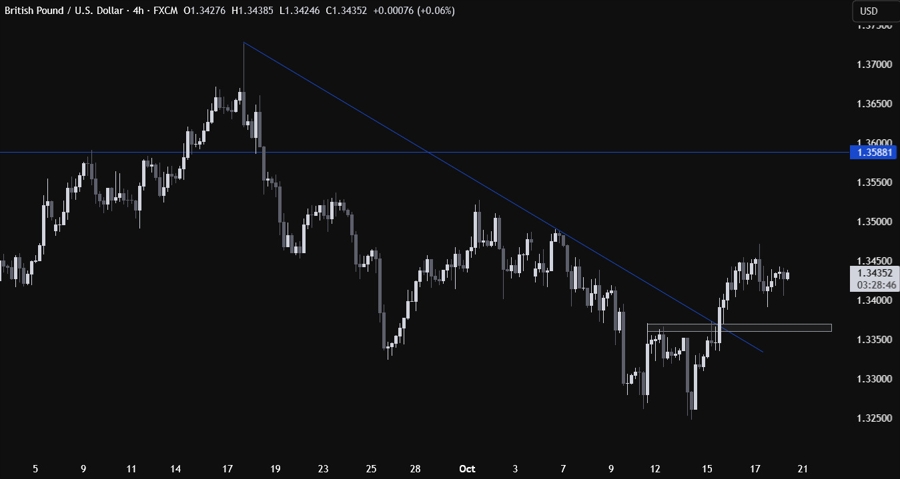
On the 4 hour chart, we can see that we have a minor support zone around the 1.3365 level. If we get a pullback, we can expect the buyers to step in there with a defined risk below the support to position for a rally into the 1.3588 level. The sellers, on the other hand, will want to see the price breaking lower to pile in for a drop into new lows.
GBPUSD Technical Analysis – 1 hour Timeframe
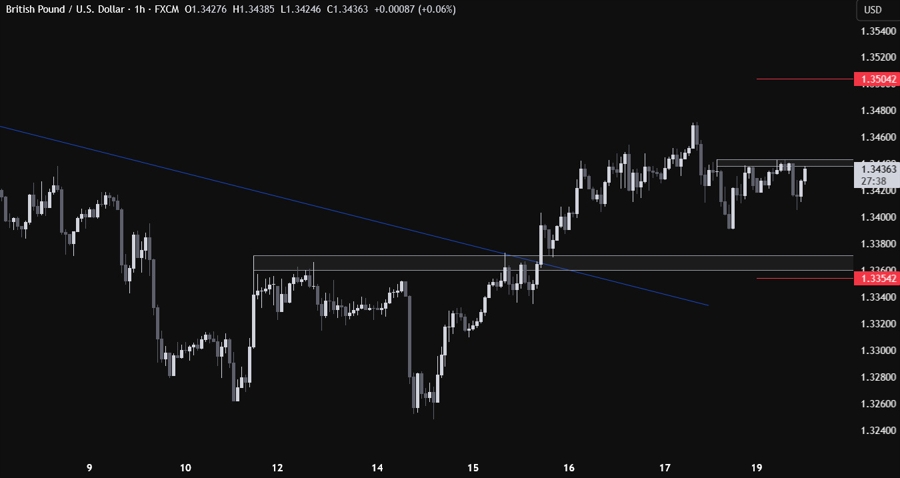
On the 1 hour chart, we can see that we have a minor resistance zone around the 1.3443 level. This is where we can expect the sellers to step in with a defined risk above the resistance to position for a pullback into the 1.3365 support. The buyers, on the other hand, will look for a break higher to increase the bullish bets into new highs. The red lines define the average daily range for today.
Upcoming Catalysts
On Wednesday, we have the UK CPI report, while on Friday we get the US CPI and the US Flash PMIs data. Keep in mind that the US-China developments continue to be a key market focus.
