
FUNDAMENTAL OVERVIEW
USD:
The US Dollar weakened across the board on Friday after the US Supreme Court struck down Trump’s reciprocal tariffs. The policy uncertainty is what is likely to have weighed on the greenback because on net, not much has changed.
Trump has already imposed new tariffs under a different law and USTR Greer has stated that the tariff deals remain in place and they will be honoured. Moreover, the new levies actually reduce the effective average tariff rate, so it could be a positive.
The dollar might stay on the backfoot for now amid the uncertainty, but I don’t think the big picture has changed much. The real risks remain a potential US-Iran military escalation which could boost the greenback on severe risk-off mood or a hawkish repricing on stronger US data which would have a positive effect on the USD.
GBP:
On the GBP side, the probabilities for a rate cut in March increased to 75% following the much weaker than expected UK labour market report on Tuesday and mostly benign UK CPI data on Wednesday. The pound eventually fell to a new monthly low before bouncing following the US Supreme Court decision.
As a reminder, the BoE surprised with a dovish hold at the last meeting as 4 members dissented for a rate cut versus 2 expected. Moreover, they changed the guidance in the statement from "the bank rate is likely to continue on a gradual downward path" to "the bank rate is likely to be reduced further".
GBPUSD TECHNICAL ANALYSIS – DAILY TIMEFRAME
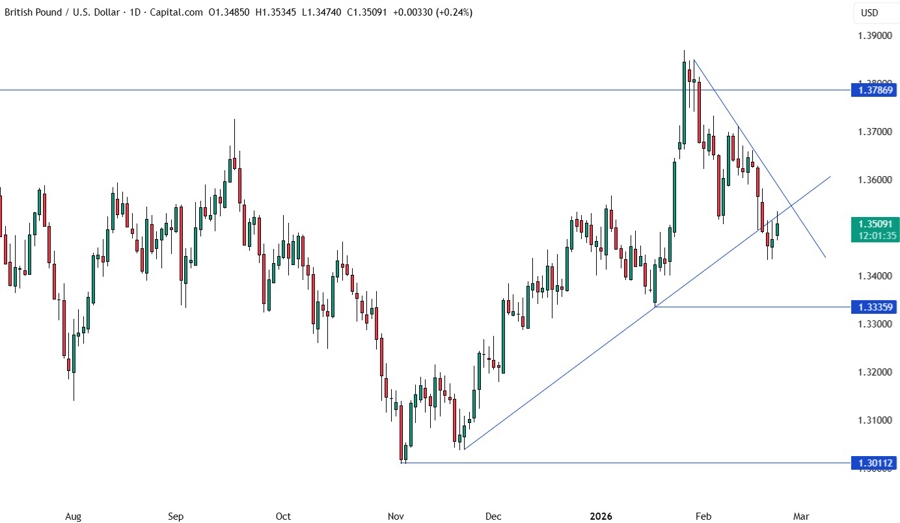
On the daily chart, we can see that GBPUSD broke below the major trendline and bounced back to retest it. The sellers will likely step in around the broken trendline with a defined risk above it to keep pushing into new lows. The buyers, on the other hand, will look for a break higher to extend the rebound into the downward trendline where the sellers will look for another short opportunity.
GBPUSD TECHNICAL ANALYSIS – 4 HOUR TIMEFRAME

On the 4 hour chart, there’s not much we can add here as the sellers will likely continue to step in around the broken trendline, while the buyers will look for an upside break to extend the gains into the downward trendline.
GBPUSD TECHNICAL ANALYSIS – 1 HOUR TIMEFRAME
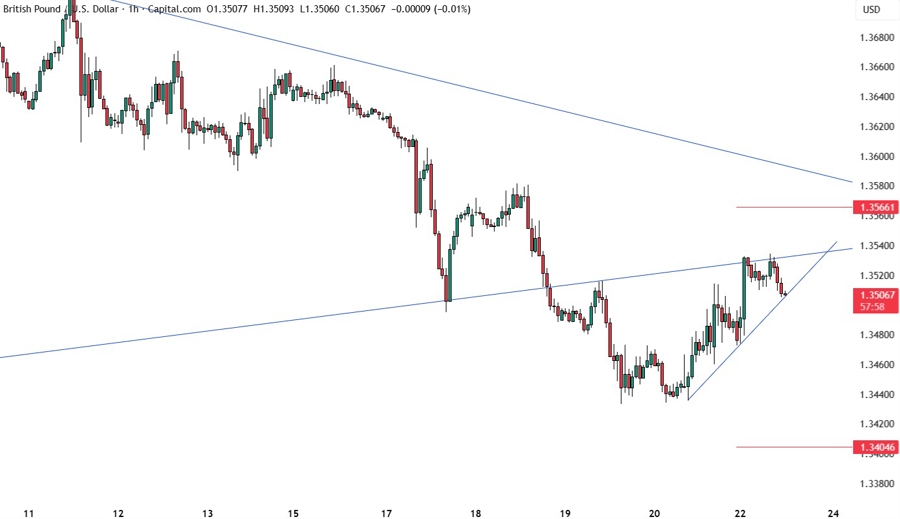
On the 1 hour chart, we have a minor upward trendline defining the bullish momentum on this timeframe. The buyers will likely continue to lean on the trendline to keep pushing into new highs, while the sellers will look for a break lower to increase the bearish bets into new lows. The red lines define the average daily range for today.
UPCOMING CATALYSTS
Tomorrow we have the weekly US ADP jobs data. On Thursday, we get the latest US Jobless Claims figures. On Friday, we conclude the week with the US PPI data. Also, keep watching out for US-Iran headlines.
