
Fundamental Overview
The USD sold off across the board on Friday following another soft NFP report. The dovish bets on the Fed increased as a result and the market is now expecting three rate cuts by year-end (70 bps). Moreover, we have also an 8% probability of a 50 bps cut in September but that will likely happen only if we get a soft CPI report on Thursday. In that case, the greenback will likely weaken further into the FOMC meeting.
Overall, if one zooms out, the US dollar continues to range although the dovish bets on the Fed keep weighing on the currency. Part of that could be the fact that the bearish positioning on the dollar could be overstretched and we might be at the peak of the dovish pricing. In fact, if the Fed cuts trigger stronger economic activity in the next months, the rate cuts in 2026 could be priced out and support the dollar. Nevertheless, the trend is still skewed to the downside, and we might need strong data to reverse it.
On the GBP side, nothing has changed fundamentally. The BoE delivered a hawkish cut at the last meeting and since then the data has been coming on the hotter side. In fact, the latest UK CPI surprised once again to the upside and the latest Flash PMIs, although mixed, showed strength and persistent inflationary pressures.
Last week, we got a selloff in the pound across the board as the UK 30yr yield jumped to a new cycle high. That was eventually erased in the following days and especially after the soft NFP report.
GBPUSD Technical Analysis – Daily Timeframe
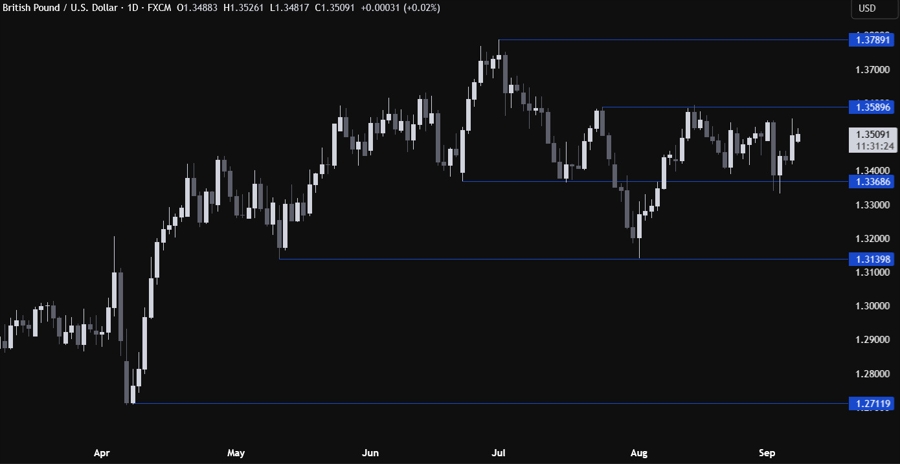
On the daily chart, we can see that GBPUSD sold off all the way back to the key 1.3368 support after the UK 30yr yields jumped to a new cycle high but eventually bounced off of the support. The price is now back near the 1.3590 resistance. If the price gets there, the sellers will likely step in with a defined risk above the resistance to position for a drop back into the 1.3368 support. The buyers, on the other hand, will look for a break higher to increase the bullish bets into the 1.3790 level next.
GBPUSD Technical Analysis – 4 hour Timeframe
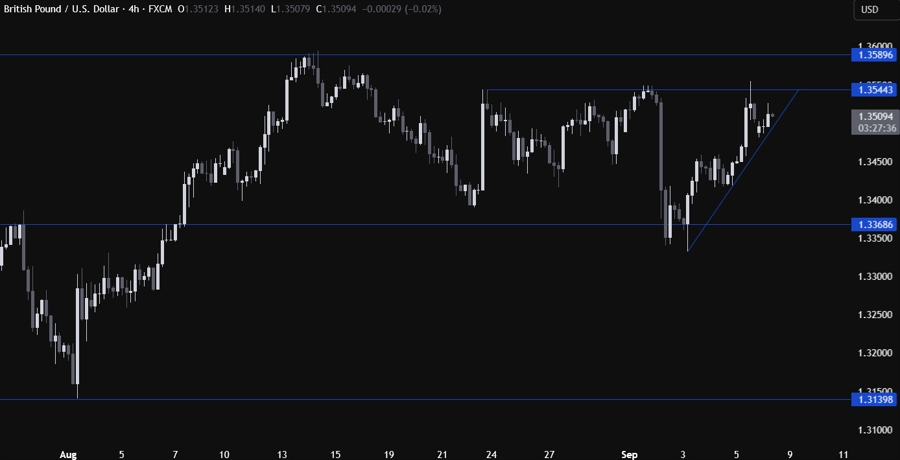
On the 4 hour chart, we can see that we have an upward trendline defining the bullish momentum. The buyers will likely continue to lean on the trendline with a defined risk below it to keep pushing into new highs. The sellers, on the other hand, will look for a break lower to position for a drop into the 1.3368 support next.
GBPUSD Technical Analysis – 1 hour Timeframe
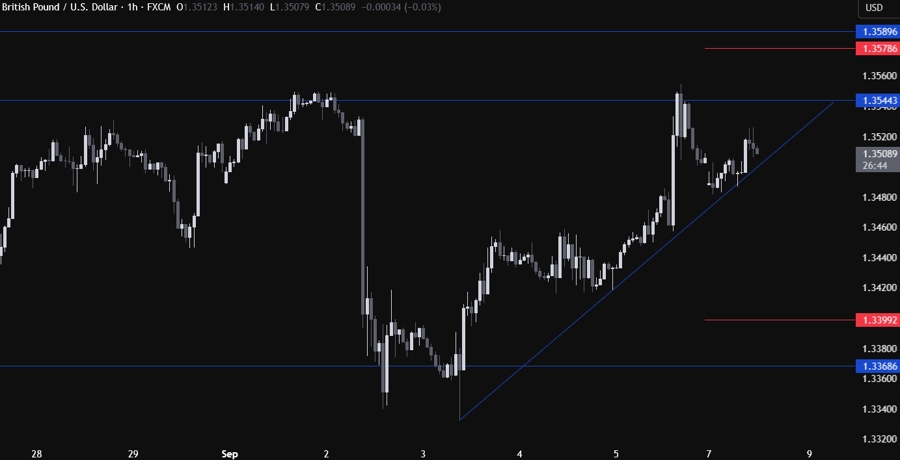
On the 1 hour chart, there’s not much else we can add here as the buyers will look for a bounce around the trendline, while the sellers will look for a break. The red lines define the average daily range for today.
Upcoming Catalysts
On Wednesday we get the US PPI report. On Thursday, we get the US CPI report and the latest US Jobless Claims figures. On Friday, we conclude the week with the UK GDP and the University of Michigan Consumer Sentiment report.
