
Fundamental Overview
The USD has weakened pretty much across the board last week despite a strong US ADP and ISM Services PMI. As mentioned previously, when markets react like that it’s generally a signal of a short-term top with the market needing more to keep the trend going.
In fact, the market pricing is now showing a 63% probability of a December cut, which is about right. The NFP and CPI reports will have the final say, and hopefully we will get them before the next FOMC decision.
On the EUR side, nothing has changed fundamentally. The ECB decision didn’t offer anything new and kept everything unchanged. ECB policymakers continue to repeat that the current policy is appropriate and that they won’t respond to small or shot-term deviations from their 2% target. The recent Eurozone data has been supporting the central bank stance as PMIs showed a rebound in economic activity and core inflation remained at 2.4% Y/Y.
EURUSD Technical Analysis – Daily Timeframe
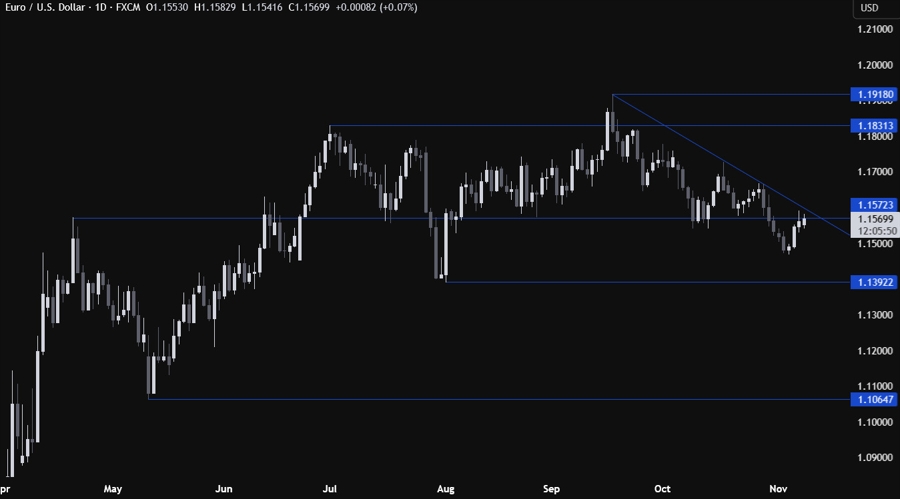
On the daily chart, we can see that EURUSD pulled all the way back to the key 1.1573 level where we have also the major downward trendline for confluence. This is where we can expect the sellers to step in with a defined risk above the trendline to position for a drop into the 1.1393 level. The buyers, on the other hand, will want to see the price breaking higher to increase the bullish bets into the 1.1700 handle next.
EURUSD Technical Analysis – 4 hour Timeframe
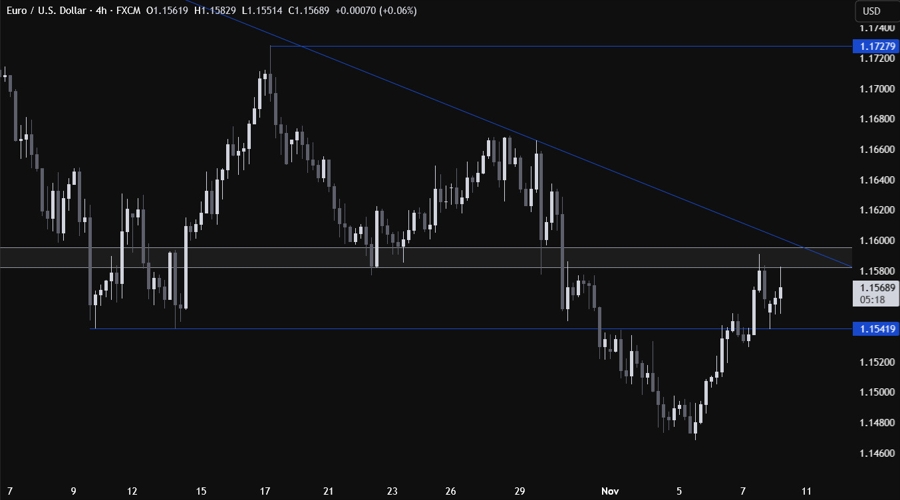
On the 4 hour chart, we can see more clearly the strong resistance zone around the 1.16 handle. Again, this is where we can expect the sellers to step in to position for a drop into new lows, while the buyers will look for a break higher to increase the bullish bets into new highs.
EURUSD Technical Analysis – 1 hour Timeframe
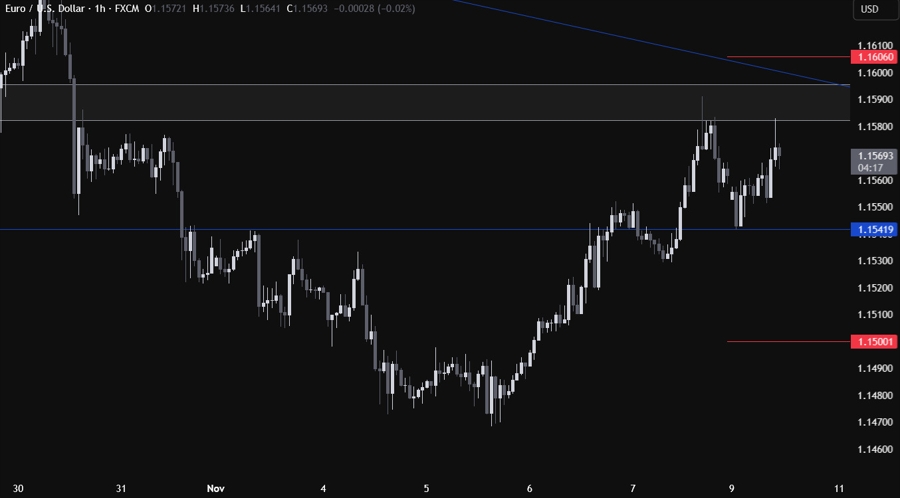
On the 1 hour chart, there’s not much else we can add here, but a break below the 1.1542 low should change the short-term trend back to bearish and likely increase the momentum. The red lines define average daily range for today.
Upcoming Catalysts
This week is pretty empty on the data front. We just have the weekly US ADP data tomorrow.
