
Fundamental Overview
The USD performance this week has been negative despite the decreasing December rate cut odds. We’ve seen also other markets behaving in a strange way, so it’s hard to pinpoint what is really driving the markets at the moment.
The focus now is of course on the Fed and the US data ahead of the December FOMC meeting. The market pricing is now showing a 50/50 chance of a cut in December, so the data will have the final say.
I don't think the September NFP expected to be released next week is going to matter much if it's soft given that it's old data, but a strong report might be taken as meaningful because the market could think that conditions were already getting better in September before the two rate cuts.
Therefore, I think the November NFP is going to have the final say, which will hopefully get released just before the FOMC meeting in December (we won't get the November CPI in time).
On the EUR side, nothing has changed fundamentally. The ECB decision didn’t offer anything new and kept everything unchanged. ECB policymakers continue to repeat that the current policy is appropriate and that they won’t respond to small or shot-term deviations from their 2% target. The recent Eurozone data has been supporting the central bank stance as PMIs showed a rebound in economic activity and core inflation remained at 2.4% Y/Y.
EURUSD Technical Analysis – Daily Timeframe
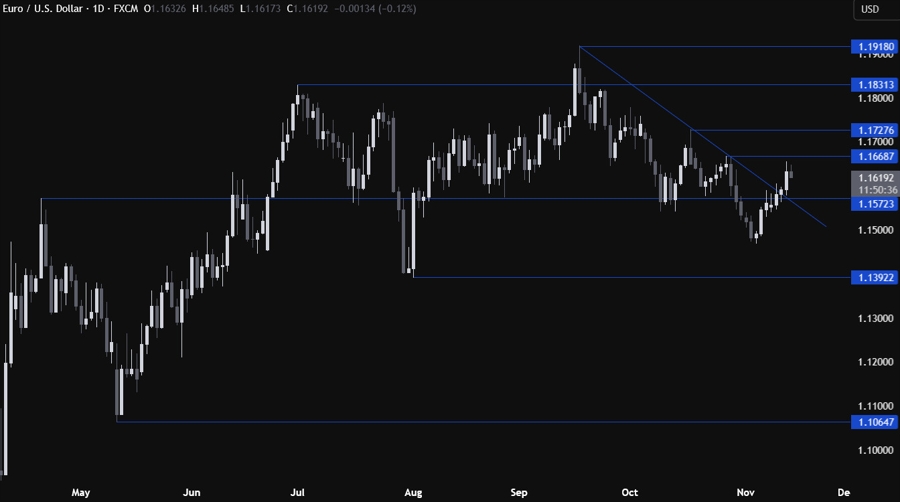
On the daily chart, we can see that EURUSD broke above the major trendline and extended the gains into the 1.1650 level as buyers increased the bullish bets. The bullish momentum remains intact for now as we continue to wait for the key US data.
EURUSD Technical Analysis – 4 hour Timeframe
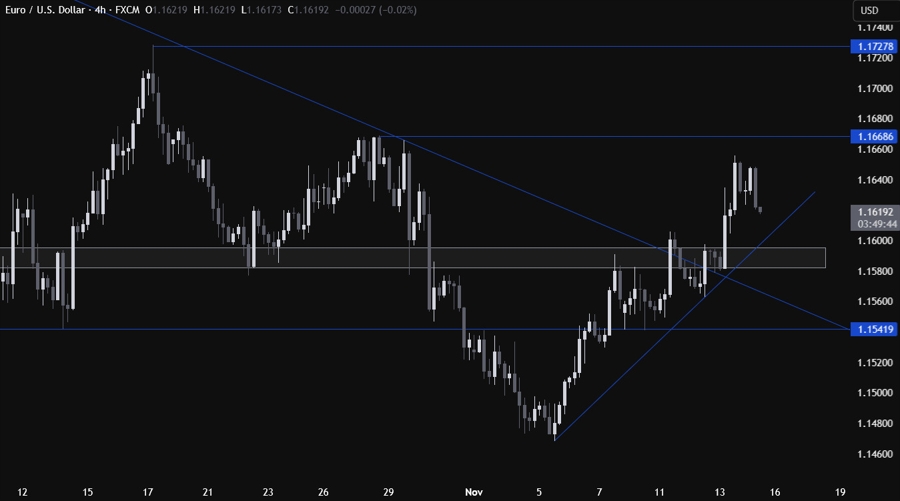
On the 4 hour chart, we can see that we have an upward trendline defining the bullish momentum. The buyers will likely lean on the trendline with a defined risk below it to keep pushing into new highs. The sellers, on the other hand, will want to see the price breaking lower to start targeting new lows.
EURUSD Technical Analysis – 1 hour Timeframe
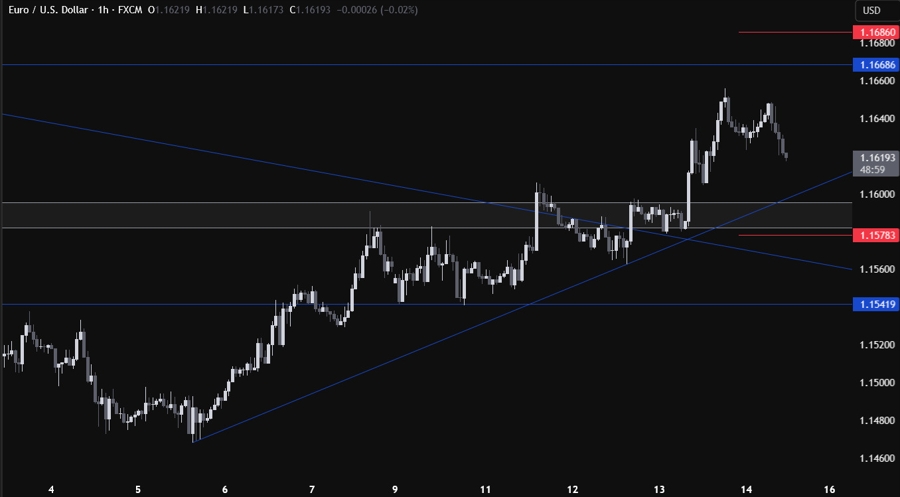
On the 1 hour chart, there’s not much else we can add here as the buyers will look for a bounce around the trendline, while the sellers will look for a break. The red lines define average daily range for today.


