
KEY POINTS:
- US dollar weakened after soft US ISM Manufacturing PMI
- Market pricing for the Fed remained unchanged around 62 bps of easing expected by year-end
- US NFP the main event this week
- For the AUD, inflation data tomorrow is key
- Given the hawkish expectations, a soft report will likely trigger bigger moves
- Soft data should weigh on the Australian dollar, while hot figures should keep supporting it
- The market is pricing a 32% probability of an RBA hike in February and a total of 42 bps of tightening by year-end
FUNDAMENTAL OVERVIEW
USD:
The US dollar weakened across the board yesterday following a soft US ISM Manufacturing PMI. The data wasn’t really surprising, but after a strong rally in the European session, the greenback gave back all the gains.
In terms of macro, nothing has changed in these two weeks. The latest NFP and CPI reports came both on the softer side and the market is still pricing 62 bps of easing by year-end. The data in December was taken with a pinch of salt given the shutdown related issues, but the next releases will give us a clearer picture.
The market expects the Fed to cut in March at the earliest, so we will need very soft data this month to force them to act sooner. Nonetheless, if the data continues to come in on the softer side, the market will likely increase the total easing for 2026 and that should weigh on the US dollar.
On the other hand, if the data shows strength, traders will likely pare back their rate cut bets and that will likely offer the greenback some support.
AUD:
On the AUD side, the RBA at the last policy decision sounded more hawkish following a series of higher-than-expected inflation reports. The central bank also discussed whether a rate hike might be needed at some point in 2026.
The market is pricing a 32% probability of a rate hike at the upcoming meeting in February with a total of 43 bps of tightening seen by year-end. Tomorrow, we get the monthly Australian inflation data. Even though the RBA focuses more on the quarterly reports, traders will likely take clues from the monthly report. That should influence rates expectations and impact the Australian dollar.
Given the hawkish expectations, a soft report will likely have a bigger impact on Australian assets. In such a case, we will likely see the AUD weakening across the board and the Australian stock market rallying. On the other hand, another hot report should keep on weighing on the stock market and support the Australian dollar.
AUDUSD TECHNICAL ANALYSIS – DAILY TIMEFRAME
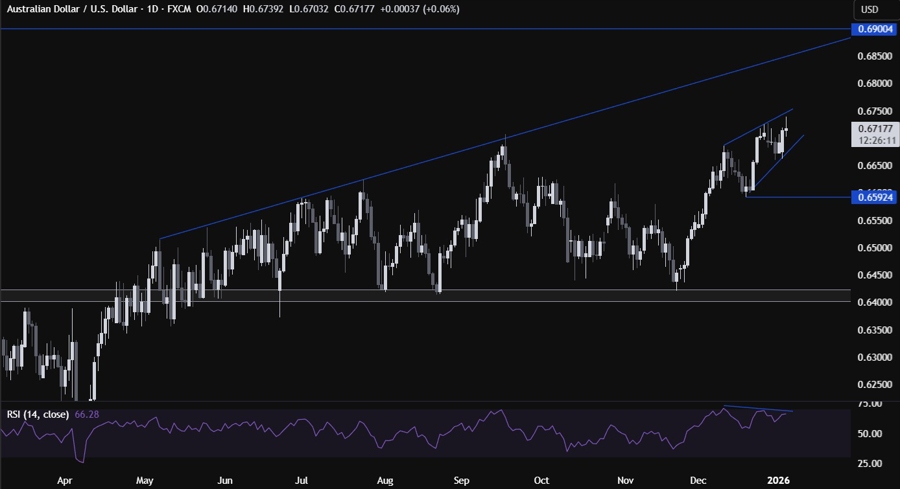
On the daily chart, we can see that we have formed a rising wedge, which is confirmed by the RSI divergence. These patterns are divergent in nature as they form when momentum fades. The price generally either bounces from the bottom trendline before rallying into new highs or breaks below the trendline and falls into the base of the wedge, which in this case is around the 0.66 handle.
AUDUSD TECHNICAL ANALYSIS – 4 HOUR TIMEFRAME
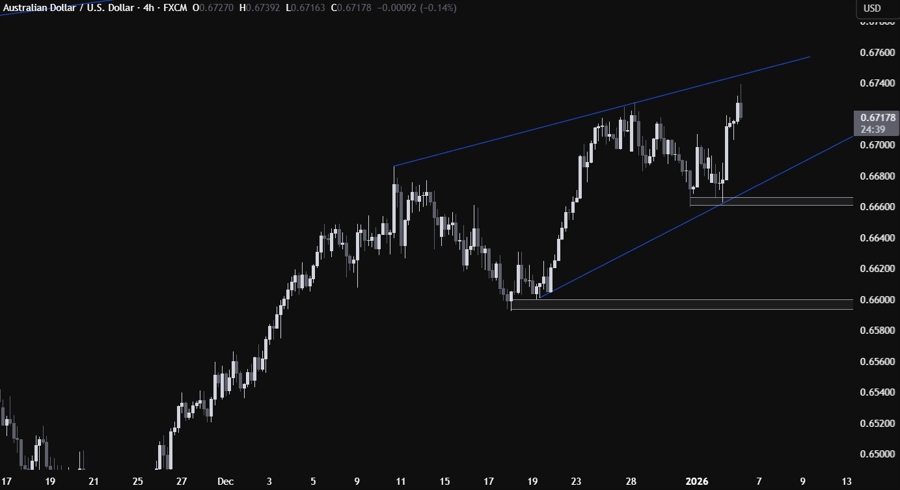
On the 4 hour chart, we can see more clearly the price action inside the wedge. The buyers will likely step in around the bottom trendline with a defined risk below the 0.6660 level to position for a rally into the 0.68 handle next. The sellers, on the other hand, will want to see the price breaking lower to increase the bearish bets into the 0.66 handle.
AUDUSD TECHNICAL ANALYSIS – 1 HOUR TIMEFRAME
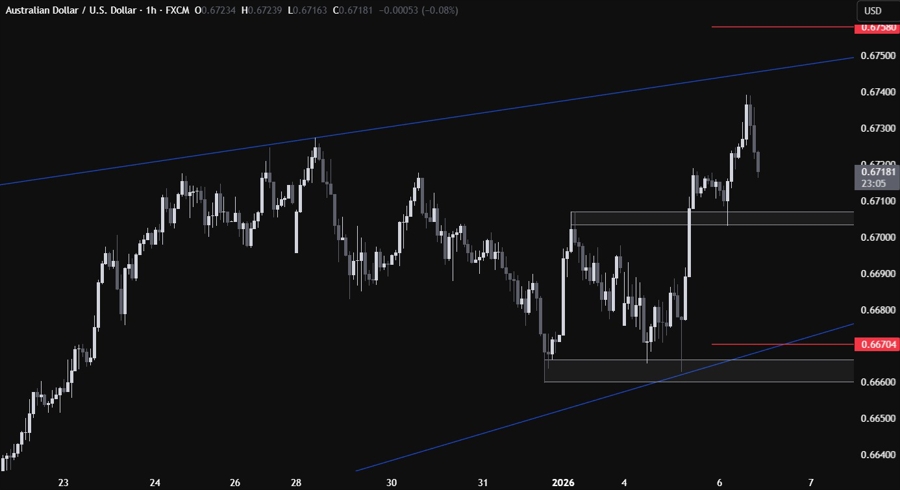
On the 1 hour chart, we can see that we have a minor support zone around the 0.6705 level. If the price gets there, we can expect the buyers to step in with a defined risk below the support to position for a rally into the top trendline. The sellers, on the other hand, will look for a break lower to increase the bearish bets into the bottom trendline. The red lines define the average daily range for today.
UPCOMING CATALYSTS
Tomorrow we have the Australian monthly inflation data, the US ADP, the US ISM Services PMI and the US Job Openings data. On Thursday, we get the latest US Jobless Claims figures. On Friday, we conclude the week with the US NFP report.


