
Fundamental Overview
The USD came under some pressure at the start of last week following the US CPI report as the data came mostly in line with expectations. In the following days though, we got some hottish data with the US PPI beating expectations by a big margin, the US Jobless Claims improving further and the inflation expectations in the UMich survey surprising to the upside.
Overall, we ended the week basically flat on the US dollar as the aggressive dovish expectations on the Fed got trimmed a bit. Nevertheless, given the overreaction from the Fed members to the last soft NFP, a September cut looks unavoidable now and only a hot NFP report in September might get us to a 50% probability (although it would certainly diminish expectations for rate cuts after the September one).
The focus has now switched to Fed Chair Powell’s speech at the Jackson Hole Symposium on Friday. Traders will be eager to see if he changes his stance as well. Most likely though, he won’t pre-commit to anything and just reiterate that they will decide based on the totality of the data.
On the AUD side, the RBA cut interest rates by 25 bps as widely expected but didn’t offer much in terms of forward guidance, although their focus switched more towards the labour market. The latest employment report missed by a little margin on the headline number but overall the data was good. The market is seeing 33% probability of a rate cut at the upcoming meeting with a total of 35 bps of easing expected by year-end.
AUDUSD Technical Analysis – Daily Timeframe
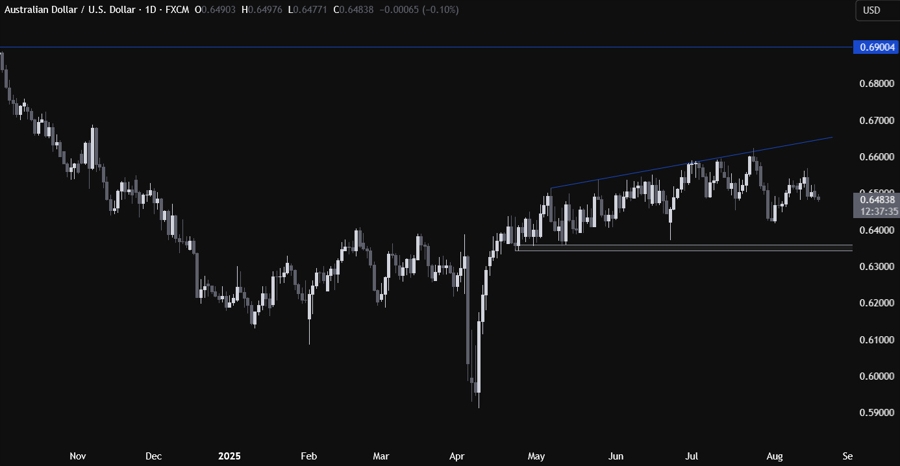
On the daily chart, we can see that AUDUSD has been pulling back from the highs after the hottish US data in the final part of last week. There’s not much we can glean from this timeframe as the price is now trading in the middle of the two key levels: the top trendline and the support zone around the 0.6350 level. We need to zoom in to see some more details.
AUDUSD Technical Analysis – 4 hour Timeframe
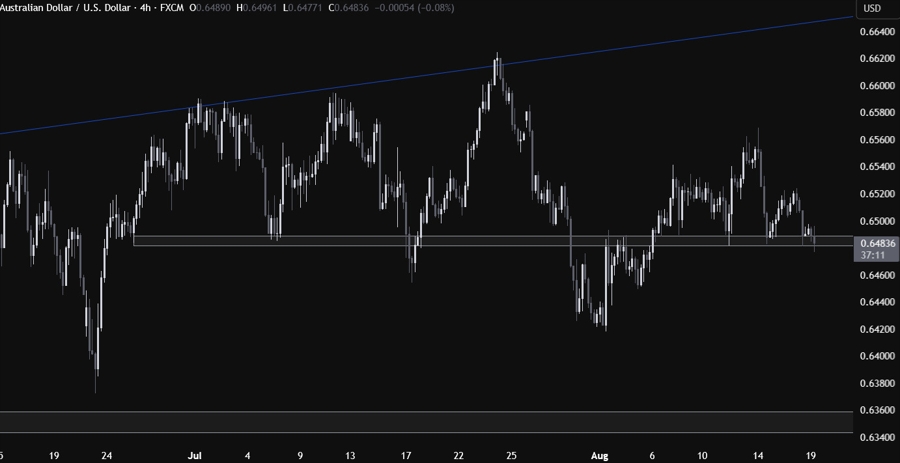
On the 4 hour chart, we can see that the price is now at the key support zone around the 0.6480 level. The buyers will likely continue to step in around these levels with a defined risk below the support to position for a rally into the top trendline. The sellers, on the other hand, will look for a break lower to start targeting the 0.6420 low and the 0.6350 support next.
AUDUSD Technical Analysis – 1 hour Timeframe
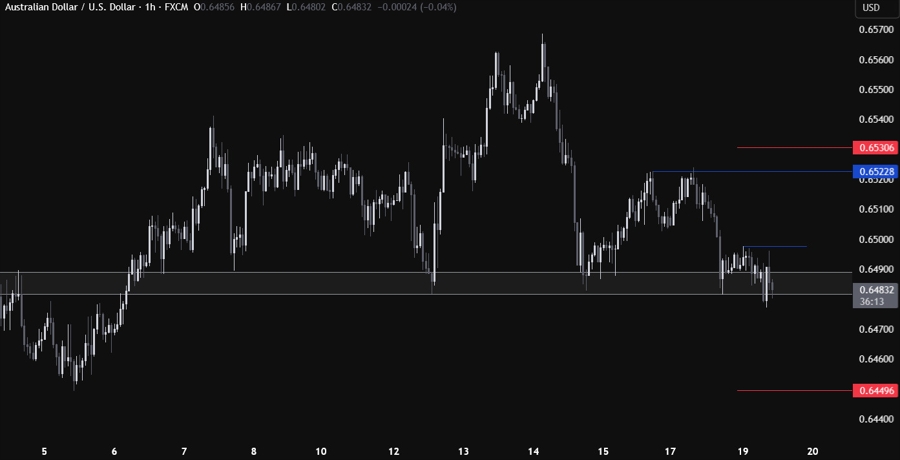
On the 1 hour chart, there’s not much else we can add here as the buyers will look for a rally from the support zone, while the sellers will look for a break lower to pile in for new lows. On an intraday basis, a break above the 0.65 handle might see the buyers increase the bullish bets into the 0.6522 level next. The red lines define the average daily range for today.
Upcoming Catalysts
Tomorrowwe have Fed’s Waller speaking and the FOMC meeting minutes. On Thursday, we get the Australian and the US Flash PMIs as well as the US Jobless Claims figures. Finally, on Friday, we conclude the week with Fed Chair Powell speech at the Jackson Hole Symposium.
