
Fundamental Overview
The USD yesterday weakened across the board on the Fed’s decision but eventually erased all the losses and increased the gains as traders digested all the information and realised it was more hawkish compared to the market pricing.
In fact, the dot plot showed that the FOMC projected two more rate cuts for 2025 by a narrow majority, with the rest of officials expecting just one more or even none. Moreover, the Fed projected just one cut in 2026 compared to three that the market was pricing before the decision.
Fed Chair Powell then labelled the rate cut as a “risk management” action given the weakening in the labour market data. But overall, he sounded pretty neutral even though he understandably placed more emphasis on the labour market given the two consecutive soft NFP reports.
Looking forward, it’s going to be all about the data. Strong data will likely trigger a hawkish repricing in interest rates expectations and support the greenback. On the other hand, weak data will likely continue to weigh on it.
On the AUD side, the RBA cut interest rates by 25 bps as widely expected at the last meeting but didn’t offer much in terms of forward guidance, although their focus switched more towards the labour market.
The employment report today missed expectations, but the unemployment rate held steady. All in all, it was slightly weak but nothing that should prompt the RBA to cut rates. In fact, the market pricing remained unchanged with an 82% probability of no cut at the upcoming meeting and 30 bps of easing by year-end.
AUDUSD Technical Analysis – Daily Timeframe
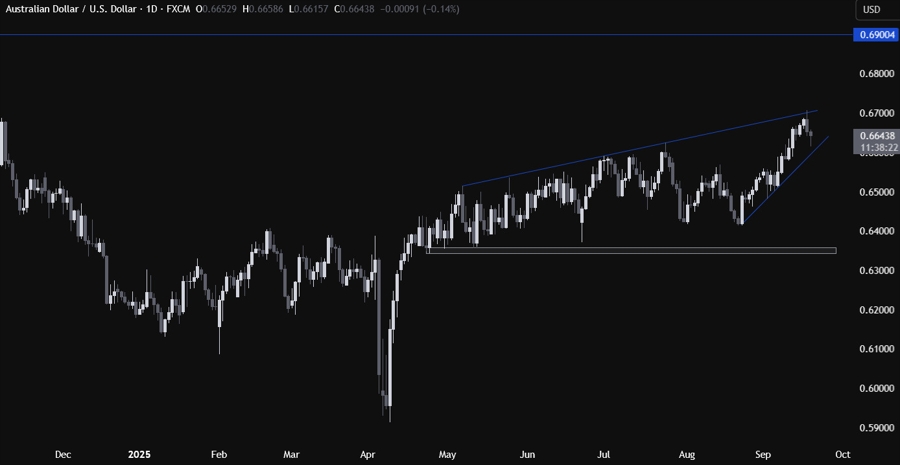
On the daily chart, we can see that AUDUSD eventually extended the rally into the top trendline where we got a rejection as the sellers stepped in. We have an upward trendline defining the bullish momentum and if we get a pullback into it, we can expect the buyers to lean on the trendline with a defined risk below it to position for a rally into new highs. The sellers, on the other hand, will look for a break lower to increase the bearish bets into the 0.6350 support zone.
AUDUSD Technical Analysis – 4 hour Timeframe
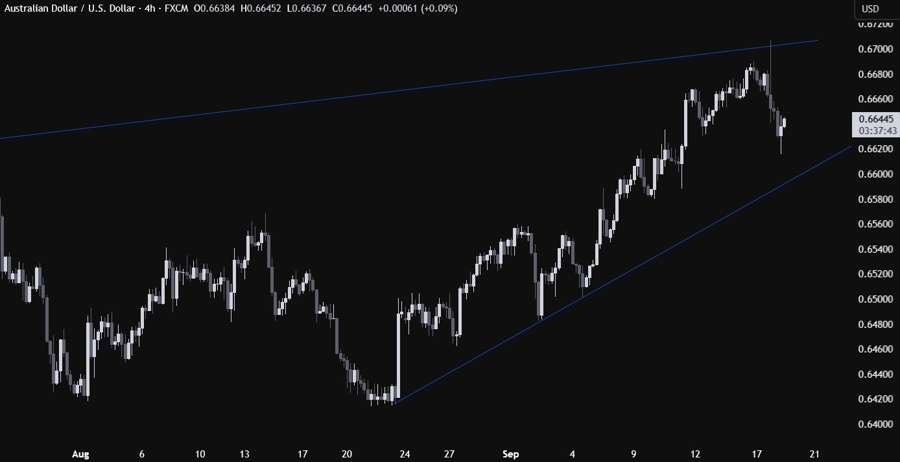
On the 4 hour chart, there’s not much we can glean from this timeframe, so we need to zoom in to see some more details.
AUDUSD Technical Analysis – 1 hour Timeframe
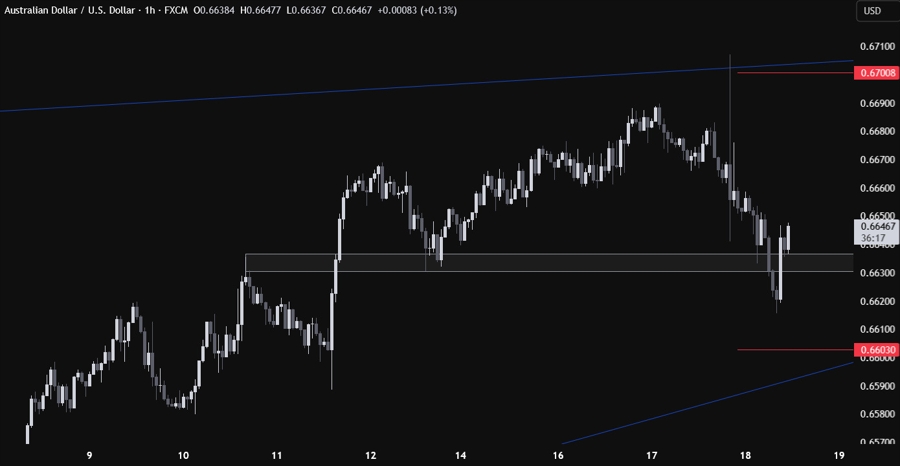
On the 1 hour chart, we can see that we have a significant support zone around the 0.6635 level. We probed below it but eventually rallied back above it. The buyers will likely continue to step in around the support to keep targeting new highs, while the sellers will look for a break lower to increase the bearish bets into the major trendline. The red lines define the average daily range for today.
Upcoming Catalysts
Today we get the latest US Jobless Claims figures.


