
Fundamental Overview
The USD sold off across the board on Friday following another soft NFP report. The dovish bets on the Fed increased as a result and the market is now expecting three rate cuts by year-end (70 bps). Moreover, we have also a 8% probability of a 50 bps cut in September but that will likely happen only if we get a soft CPI report tomorrow. In that case, the greenback will likely weaken further into the FOMC meeting.
Overall, if one zooms out, the US dollar continues to range although the dovish bets on the Fed keep weighing on the currency. Part of that could be the fact that the bearish positioning on the dollar could be overstretched and we might be at the peak of the dovish pricing.
In fact, if the rate cuts trigger stronger economic activity in the next months, the rate cuts in 2026 could be priced out and support the dollar. Nevertheless, the trend is still skewed to the downside, and we might need strong data to reverse it.
On the AUD side, the RBA cut interest rates by 25 bps as widely expected at the last meeting but didn’t offer much in terms of forward guidance, although their focus switched more towards the labour market. The latest employment report missed by a little margin on the headline number but overall, the data was good. The market is seeing an 82% probability of no change at the next meeting and a total of 30 bps of easing by year-end.
AUDUSD Technical Analysis – Daily Timeframe
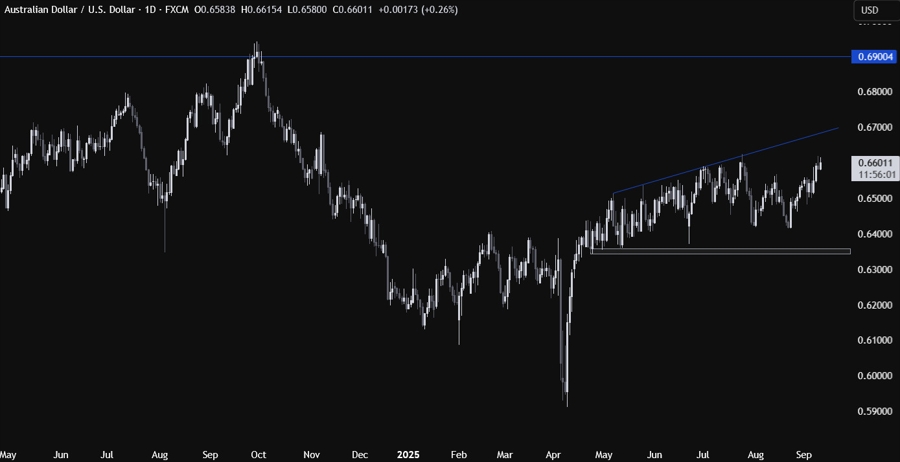
On the daily chart, we can see that AUDUSD has been rising steadily since Powell’s dovish tilt and extended the rally following last Friday’s soft NFP report. The buyers will continue to target the top trendline where we will likely find sellers again stepping in to position for a drop back into the 0.6350 support zone.
AUDUSD Technical Analysis – 4 hour Timeframe
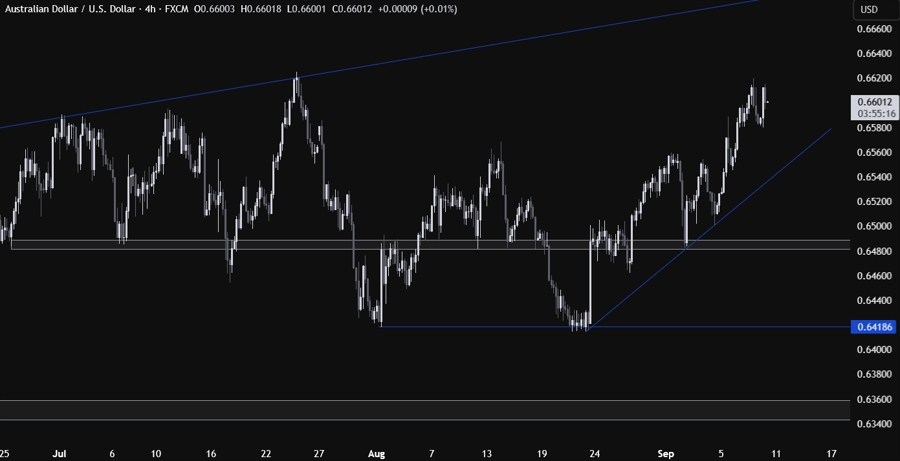
On the 4 hour chart, we can see that we have an upward trendline defining the bullish momentum. If we get a pullback, the buyers will likely lean on the trendline with a defined risk below the trendline to position for a rally into new highs. The sellers, on the other hand, will look for a break lower to increase the bearish bets into new lows.
AUDUSD Technical Analysis – 1 hour Timeframe
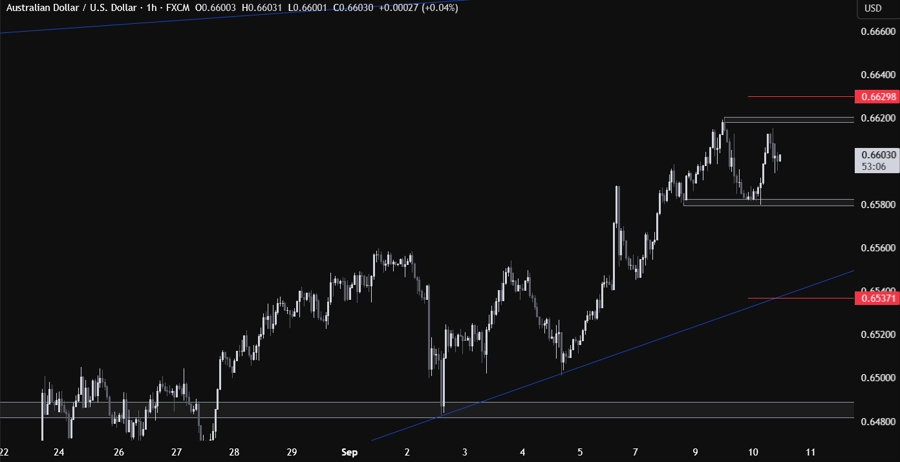
On the 1 hour chart, we can see that the recent rally stalled a bit as market participants await the US inflation data. If we get a break below the recent swing level around the 0.6580 level, the sellers will likely pile in for a pullback into the trendline. The buyers, on the other hand, will likely step in around the recent support or pile in on a break above the 0.6620 high. The red lines define the average daily range for today.
Upcoming Catalysts
Today we get the US PPI report. Tomorrow, we get the US CPI report and the latest US Jobless Claims figures. On Friday, we conclude the week with the University of Michigan Consumer Sentiment report.
