
FUNDAMENTAL OVERVIEW
Oil prices rallied all the way back to the resistance around the 66.50 level after a report from Axios suggested that a war between the U.S. and Iran appeared increasingly likely. Traders hedged into the weekend risk driving prices higher.
There was no escalation over the weekend, on the contrary, we got some positive signals with the Oman’s Foreign Minister confirming a third round of talks between the two parties on Thursday in Geneva. Oil prices eased consequently as the market reopened.
The market expectation is still skewed towards some type of military intervention which keeps the geopolitical risk premium high. In fact, it was reported that the US military build-up in the region was the greatest since invasion of Iraq in 2003.
Given Trump’s military build-up and escalated rhetoric, it may be difficult for him to de-escalate without Iran offering significant concessions on its nuclear program. If a military conflict were to break out, we would likely see oil prices skyrocket due to the risk of disruption in the Strait of Hormuz, especially in light of the recent military drills.
We would likely need signs of US military withdrawal or a deal between US and Iran to see oil prices falling back towards the $60 price area. For now, the tensions will keep the market supported.
CRUDE OIL TECHNICAL ANALYSIS – DAILY TIMEFRAME
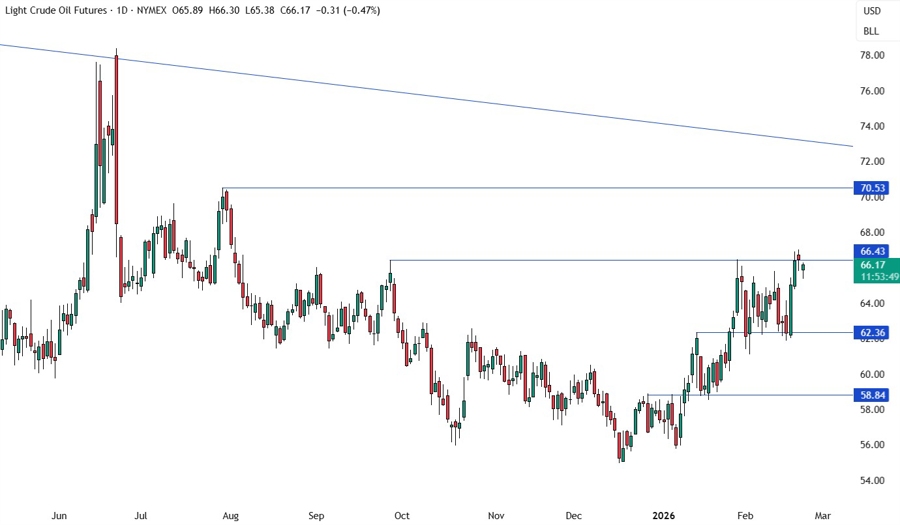
On the daily chart, we can see that crude oil rallied all the way back to the key 66.43 level. The momentum waned as US-Iran tensions eased a bit and the sellers stepped in to target a drop back into the support. The buyers will want to see the price breaking higher to increase the bullish bets into the 70.50 level next.
CRUDE OIL TECHNICAL ANALYSIS – 4 HOUR TIMEFRAME
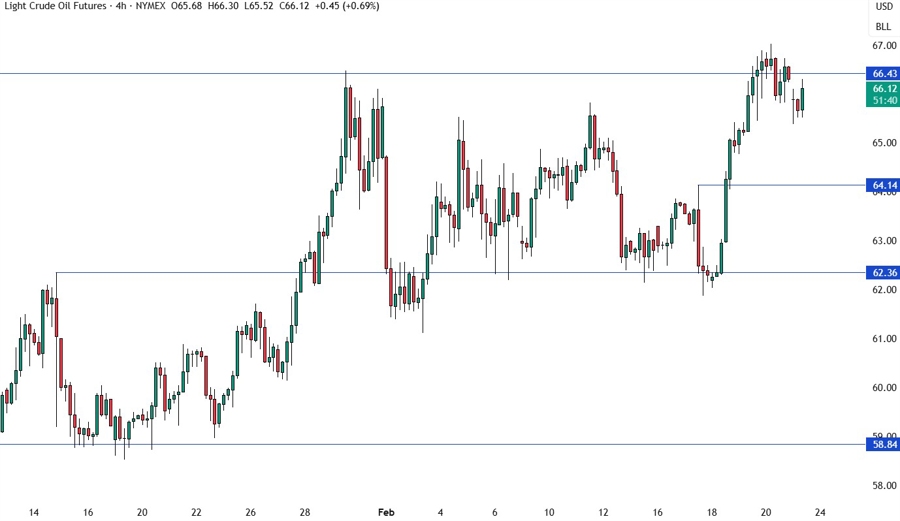
On the 4 hour chart, there’s not much we can add here as the sellers will likely continue to step in around the 66.43 level to target a drop into the 62.36 support, while the buyers will look for above the resistance to extend the rally into the 70.50 level next. We have also a mid-range support around the 64.14 level where aggressive dip-buyers could step in.
CRUDE OIL TECHNICAL ANALYSIS – 1 HOUR TIMEFRAME
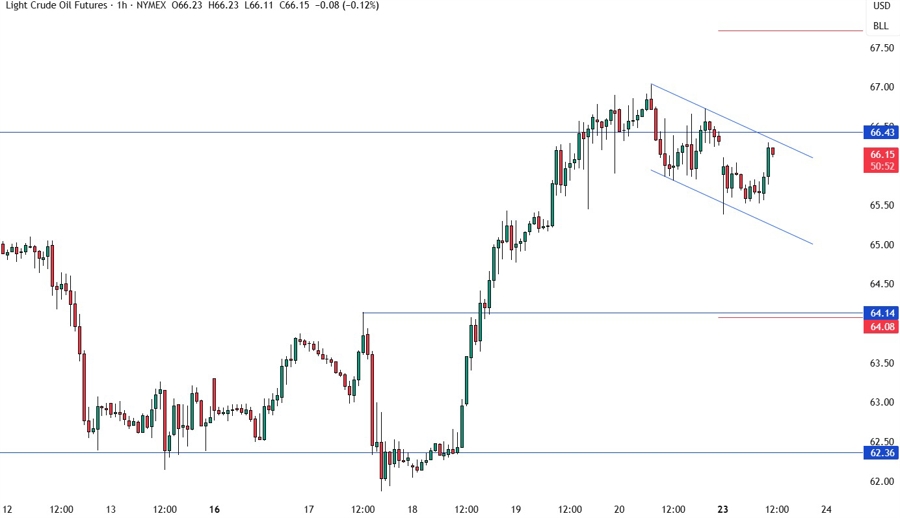
On the 1 hour chart, we can see the price slowly pulling back from the 66.43 resistance. We might be forming a bullish flag, but the price will need to break above the top trendline to confirm it. In that case, we can expect the buyers to pile in to position for a rally into new highs. The sellers, on the other hand, will likely continue to lean on the top trendline with a defined risk above it to keep pushing into the 62.36 support. The red lines define the average daily range for today.
UPCOMING CATALYSTS
Tomorrow we get the weekly US ADP jobs data. On Thursday, we have the third round of US-Iran nuclear talks in Geneva and the latest US Jobless Claims figures. On Friday, we conclude the week with the US PPI report. Also, keep watching out for US-Iran headlines.


