
FUNDAMENTAL OVERVIEW
Oil prices remain supported amid the US-Iran war and the virtually closed Strait of Hormuz. The bullish momentum has waned though due to some de-escalatory signals in the past couple of days.
Just this morning, the Iranian Deputy Foreign Minister said that Iran was ready to abandon its nuclear program on condition that the United States presented a satisfactory alternative offer. Yesterday, we got a NYT report saying that Iran was secretly contacting the US to find a solution to end the war, although the Iranians dismissed the report as fake news.
The market might have also been expecting a de-escalation sooner rather than later as the US stocks remained resilient despite the negative pressure. We might be one Truth Social post away from a strong relief rally if Trump announces the start of negotiations or that the US has reached all its objectives.
CRUDE OIL TECHNICAL ANALYSIS – DAILY TIMEFRAME
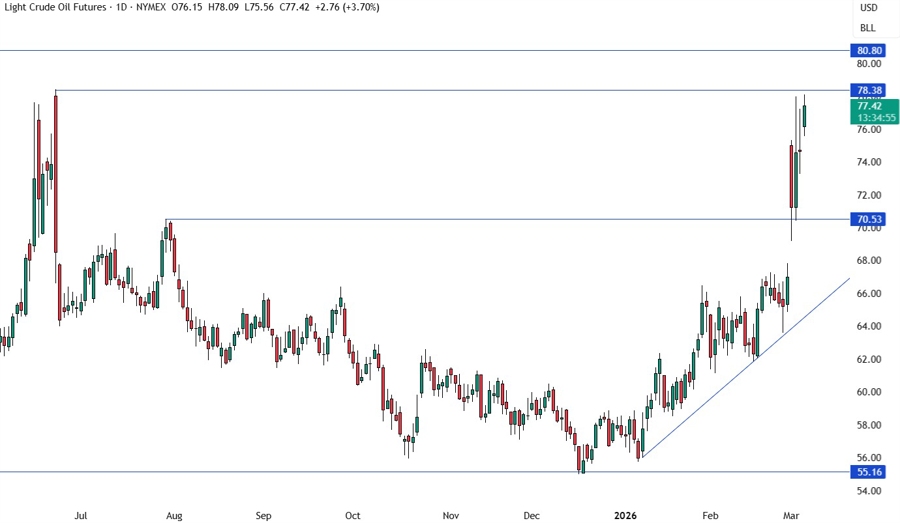
On the daily chart, we can see that crude oil extended the gains into the highest level since the last US-Iran escalation in June. This is where we can expect the sellers to step in with a defined risk above the level to position for a drop back below the 70.00 handle. The buyers, on the other hand, will look for a break higher to increase the bullish bets into the 80.00 handle.
CRUDE OIL TECHNICAL ANALYSIS – 4 HOUR TIMEFRAME
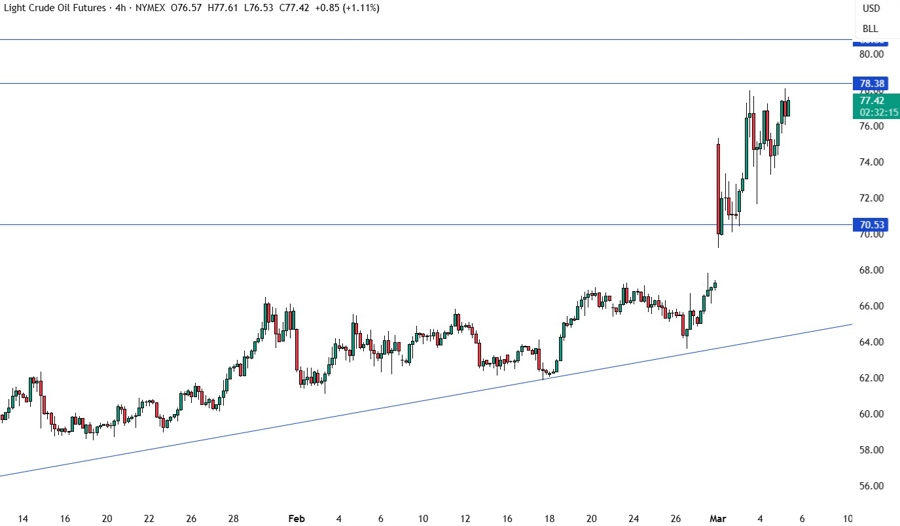
On the 4 hour chart, we can see the momentum has been waning into the 78.38 level due to high uncertainty and conflicting signals on the Strait of Hormuz. There’s not much we can glean from this timeframe, so we need to zoom in to see some more details.
CRUDE OIL TECHNICAL ANALYSIS – 1 HOUR TIMEFRAME
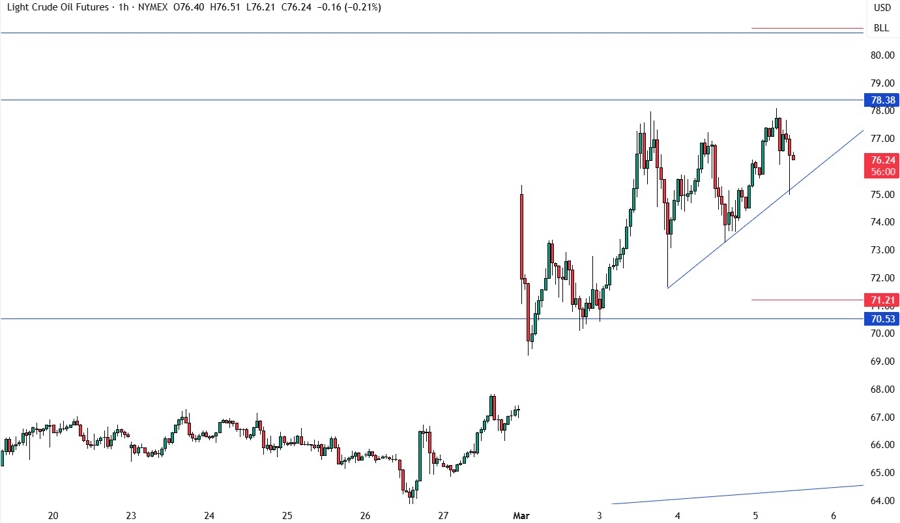
On the 1 hour chart, we have a minor upward trendline defining the bullish momentum on this timeframe. The buyers will likely continue to lean on the trendline with a defined risk below it to keep pushing into new highs, while the sellers will look for a break lower to target a pullback into the 70.00 handle next. The red lines define the average daily range for today.
UPCOMING CATALYSTS
Today we get the latest US Jobless Claims figures. Tomorrow, we conclude the week with the US NFP report. Continue to keep an eye on the US-Iran war headlines as that’s what the market is focused on right now.
